This video demonstrates how to update your Mapp Intelligence Analysis directly within Excel using the Intelligence API.
The exact paths and designations may differ depending on your Excel version.
All the steps we mention in the video are listed below.
Before anything, you must have API activated for your Mapp Intelligence Account. If not already active, please reach out to your CSM. |
Step | Navigation path | Description | |
|---|---|---|---|
1 | User Management > Roles > Account Configuration | Make sure the user has permission to access the API.
| |
2 | Settings > API Client IDs |
Find more information here. | |
3 | Visitors > Time > Weeks |
| |
4 | Excel file configuration |
| |
5 | Excel file update | Click Data > Refresh All to update data.
|

Additional information
Please be sure that you have the correct upper and lower limits set. When you copy the JSON from Mapp Intelligence, the upper limit will stay the same as it is onsite. If you would like to increase it, you can either change it before you copy the JSON or after in the JSON itself. Mapp can produce results with 5 million rows, but limits may apply depending on your consuming system (e.g. Excel).
Automated Import
In Excel, open your file.
For an example, please see this file
Please note, this file is only an example and does not cover all potential scenarios and uses.
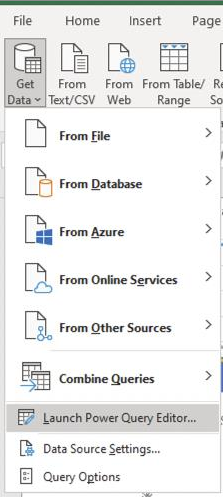
Select Power Query editor.
In getToken replace <> placeholders with values
clientiD="<clientiD>",
clientSecret="<clientSecret>",
In getAnalysisData
Paste your JSON into queryAsJson = "<yourJSON>".
Please be sure that you check and update noOfDimensionColumns to make sure it matches the number of dimension columns you will get from your results.
Execute
If you receive an error that Authentication is not specified, go to data source settings and configure the URLs shown to use anonymous. Since PowerBi does not allow data sources to be called from a URL that was transmitted by default, you have to activate ignore privacy settings.
getData > Query Options > Privacy (global and current workbook) > Select Ignore Privacy Levels…
Alternatively:
Change the script to use fixed status and result URLs.
Add the correlationID to the statusURL and the calculationID to the resultURL which you received in the response.
Manual Data Transformation
First, you will need to complete your authentication, send a JSON query, and receive your results. for example:
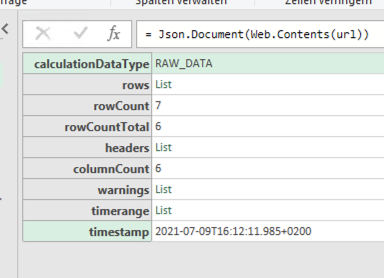
Then you can follow these steps to transform your results into a table.
How to set up headers:
Right-click List in the header row and set it as a new query.
Convert to a table.
Click the expand icon.
Uncheck keep original names as a prefix.
Delete columns that should not be used as a header.
Transpose table.
Select the API connection that you configured in the Credential Store from the drop-down list under Credential Store Record.
Select the GET Method and UTF-8 encoding.
How to set up rows
Right-click List in the row and set it as a new query.
Convert to a table.
Add a custom column and replace the given formula with:
List.First([Column1])CODE
Add another custom column, replacing the formula with:
List.First(List.Skip([Column1],1))CODE
Continue for every available column in your results, increasing the column number accordingly.
Remove the first column with the values "List".
Define value replacement null to 0 as needed.
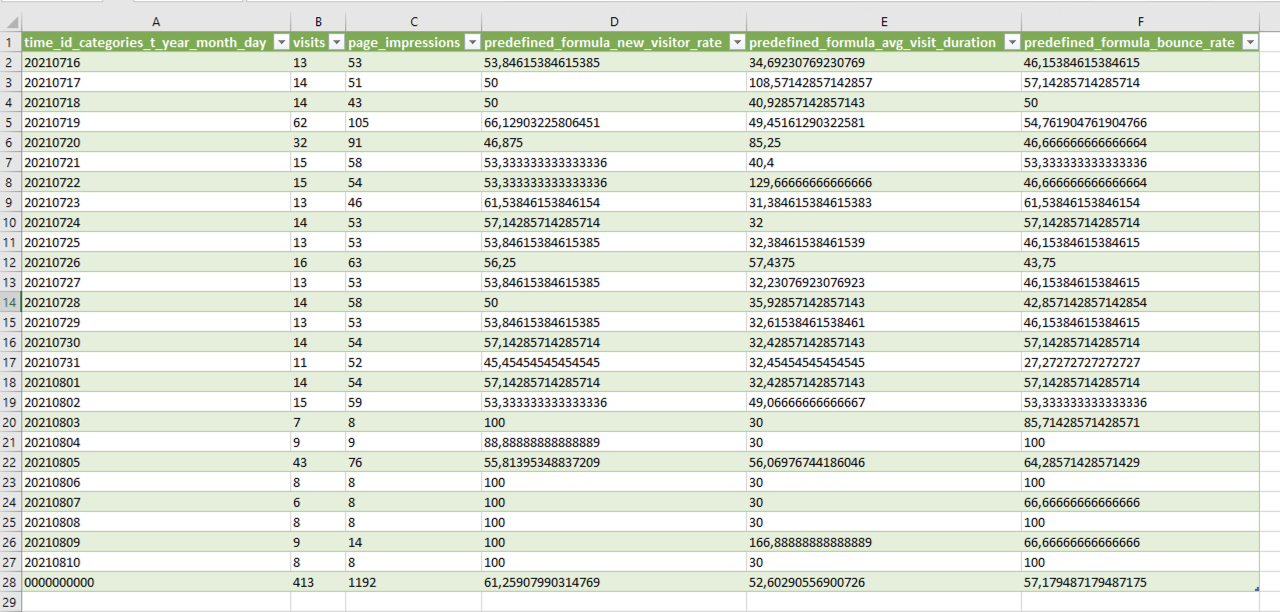
Check your results.
Click close and load.
Copy your header and row query into a single sheet.
Now you should be able to view your table with the data.
Please note that onsite, if there are no values returned, you will see a 0. However, When using an API this will return as null.