Supported analysis variants and elements
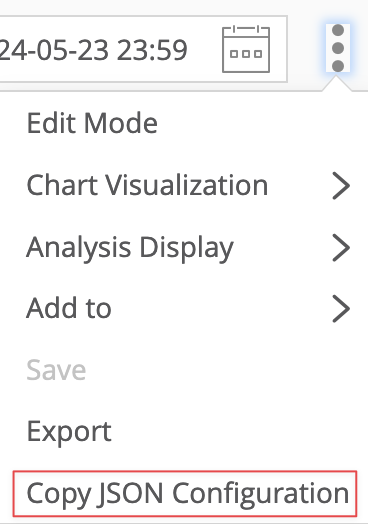
The setup is very easy: you can directly copy the JSON Configuration from analyses in Mapp Intelligence and use it to make queries via the API.

The following analysis variants and elements are currently supported:
List (Analysis variant)
Time ranges
When using a time range, please make sure that you are using time ranges properly.
If you want to see all data for November 8th, the values should be set:
"value1": "2024-11-08 00:00:00",
"value2": "2024-11-09 00:00:00”
General information about responses
The results are shown in the same organized structure as the columns in the Intelligence User Interface.
The first part of the response contains the data retrieved with the call (section "rows"). These results have a total row count, followed by the requested metrics.
The column names in the "headers" section are ordered as they are in Mapp Intelligence.
Please note that onsite, if there are no values returned, you will see a 0. However, When using an API this will return as null.
Some more things to note:
Not every output will be relevant to your analysis. For example, arrangeType and alias are used for our internal processing.
When you see 0000000000, this is the same as seeing the Total row heading in the Intelligence interface.