This article shows you, how to analyze the usage of the internal search of your website with Mapp Intelligence.
1. Preface
A comprehensive understanding of how the website visitors use the internal search of my website is the basis for its optimization. This article covers multiple possibilities for analyses, based on the example of an online shop. It is not meant as a complete list but rather aims on giving ideas for analyzing the internal search of websites.
For the best possible tracking, optimal integration of the pixel for the internal search is required. Detailed information about doing this can be found in the article How to track your internal Search optimally.
At some points, custom metrics and formulas are used in the shown examples. These are marked with a "*" in the text and reading examples. Details for configuring these figures are shown at the end of the article.
2. How successful is the internal search of my website?
2.1 How often is the internal search of my website used?
As a first step, we look into the question of how often the internal search is used at all. Of interest could be the total number of visits in which the internal search was used as well as its relation to all visits of the website.
For doing so, we work with the custom metric "Internal search: Qty Visits with internal search*", which shows the number of visits with the usage of the internal search. The figure "Internal search: Visits with internal search %*" depicts the share of visits with the usage of the internal search on the total number of visits.

Reading Example | |
|---|---|
Visits | 319,206 visits were tracked on our website in December 2016. |
Internal search: Qty Visits with internal search* | In December 2016 the internal search was used in 55,918 visits. |
Internal search: Visits with internal search %* | In 17.52 % of all visits in December 2016 the internal search was used. |
In our example, the share of visits with internal search lies constantly between 17 and 18 %.
2.2 How successful is the internal search over time?
The frequency of visits with usage of the internal search is not saying anything about the actual success of the internal search function. Also the number of search operations, which in this example is depicted by the metric "Internal search: Qty Search phrases*", is only of limited use, as for example navigating to the second page of the search results page is counted as a new search operations (see the article How to track your internal Search optimally for avoiding this kind of multiple counting).
As a consequence we will work with some important key figures, that can provide a better impression of the quality and success of the internal search function:
Internal Search: Searches with results %*: The number of search operations, that delivered at least one search result, depicts the quality of the internal search. If this figure is low (thus, often no search results are displayed), the internal search functions is not helpful for the website visitors and should be optimized.
Internal search: Conversion rate %*: The conversion rate is another important success criterion. It shows, in how many visits with usage of the internal search a conversion (in our case an order) happened. Compared with the overall conversion rate of my website this can be a good indicator for determining, whether the use of the internal search influences the reach of my website goals positively or negatively.
Internal search: Order value Avg*: The average order value, that was generated in visits with use of the internal search, could also be an indicator for the contribution of the internal search to the reach of the website goals. Similar to the conversion rate it can be compared to the average order value, that is generated in all visits of my website.
A look at the success of the internal search over time gives us the possibility to discover seasonal fluctuations. For this purpose we analyze the success of the internal search of our website on a monthly basis.

Reading Example | |
|---|---|
Internal search: Qty Search phrases* | 222,182 internal search operations were recorded in December 2016. |
Internal search: Searches with results %* | 21.32 % of the internal search operations displayed at least one search result. |
Internal search: Conversion rate %* | In 15.55 % of all visits with the use of the internal search an order was made. |
Internal search: Order value Avg* | With this, an average order value of 125.28 Euros was generated. |
It becomes evident, that in all analyzed months only every fifth search operations delivered results at all.
Contrary to this the conversion rate for visits with internal search is high with 15.55 %, even though it declines during Q4 2016.
Also, the average order value in visits with the use of the internal search is changing only slightly.
2.3 Is there a difference between new and returning visitors?
It is possible, that various visitor segments use the internal search differently. For example, users, that haven't been on our website before, may have difficulties with using the navigation structure of the website and therefore use the internal search function more often. Perhaps the internal search is the preferred way to an order for all visitors. In order to answer these questions we analyze possible differences between new and returning visitors.

Reading Example | |
|---|---|
Visits | 81,026 visits in the analysis time period were done by returning visitors. |
Internal search: Visits with internal search %* | In 24.02 % of all visits done by returning visitors, the internal search was used. |
Internal search: Qty Search phrases* | With this, a total of 76,131 search operations were carried out. |
Internal search: Searches with results %* | 23.55 % of these internal search operations displayed at least one search result. |
Internal search: Conversion rate %* | In 39,81 % of all of these visits with the use of the internal search an order was placed. |
Internal search: Order value Avg* | With this, an average order value of 129.68 Euros was generated. |
In our example, a closer view reveals, that returning visitors use the internal search proportionally more often than new visitors.
Furthermore, their internal searches provide search results more often, than those done by new visitors.
The biggest difference occurs with the conversion rate: Returning visitors, who use the internal search, place orders more often than new visitors. Also their average order value in visits with internal search is significantly higher.
2.4 Is there a difference between device classes?
Technical circumstances can influence the usage and success of the internal search. If the majority of users is accessing the website via mobile phone, it should be made sure, that the internal search function can be used optimally via these device classes. Maybe there are also some display errors of the search field or results page, that affect the usage frequency or the influence of the internal search on the reach of the website goals negatively.
In order to identify such saliences, we take a closer look at the device classes the visitors use to access our website. For further steps it could be interesting to add the specific devices or browser as additional dimensions to the analysis.

Reading Example | |
|---|---|
Visits | 129,427 visits in the analysis time period were done via mobile phones. |
Internal search: Visits with internal search %* | In 16.38 % of all visits via mobile phone the internal search was used. |
Internal search: Qty Search phrases* | With this a total of 82,014 search operations were carried out. |
Internal search: Searches with results %* | 21.78 % of these internal search operations displayed at least one search result. |
Internal search: Conversion rate %* | In 13,86 % of all these visits with the use of the internal search an order was placed. |
Internal search: Order value Avg* | With this, an average order value of 126.79 Euros was generated. |
No big differences arise with the device classes in our example. Users, who access the website via PC / laptop as well as those who use mobile phones or tablets use the internal search proportionally equally often.
Also, the search delivers results on all device classes about equally often.
On the other hand, the conversion rate of visits with the use of internal search is lower for visits via mobile phone than for those via PC / laptop or tablet.
2.5 Is there a difference between the users accessing different language versions of the website?
In case you run a multilingual website, this information can be helpful. In many cases the used language version is tracked via a content group and thus available in all analyses. With this it is possible, for example, to analyze the language version the internal search is used with.
Alternatively such an analysis can be done by using the browser language. However, in this case the results are significantly more inaccurate as, for instance, website visitors could still use the German language version of the website, even though their browser language is set to English.

Reading Example | |
|---|---|
Visits | In 291,487 visits in the analysis time period the German language version of the website was used. |
Internal search: Visits with internal search %* | Visits with internal search %*: In 16.54 % of all these visits the internal search was used. |
Internal search: Qty Search phrases* | With this a total of 189,299 search operations were carried out. |
Internal search: Searches with results %* | 22.14 % of these internal search operations displayed at least one search result. |
Internal search: Conversion rate %* | In 16.46 % of all these visits with the use of the internal search an order was placed. |
Internal search: Order value Avg* | With this an average order value of 123.62 Euros was generated. |
The analysis of the content group "CG 1 - Website Language" shows, that the German language version of the website is used more often than the English version.
Thus, the majority of internal searches is performed basing on the German language version. Nevertheless, visitors using the English language version, use the internal search proportionally more often.
The other key figures are on a comparable level. It becomes evident, that the conversion rate of visits with internal search in which the German language version of the website was used, is higher. At the same time, a slightly smaller order value is generated on average.
2.6 Which products are accessed via the internal search?
If the number of product views via the internal search amounts to a big share of all product views, it can be an indicator for a low visibility of the product on our website. In order to identify such saliences, we take a close look at the product views of the specific products.
As in our example the search result page(s) is displayed after every search operation, we can filter the standard metric "Qty Product Views" easily on product views, for which the preceding page was a search result page.
Please note, that for other website setups (e.g. direct accesses of product views via search suggestions) the information about the use of the internal search should be transmitted via an e-commerce parameter. This is also required, if you want to use other key figures like "Qty Purchased Products" or "Value Purchased Products" in a meaningful way. Detailed information on the optimal measurement of the internal search can be found in the article How to track your internal Search optimally.
The data table depicts the following results:

Reading Example | |
|---|---|
Qty Product Views | The product "065cc1k034" was accessed 7,549 times in total. |
Internal search: Qty Product views* | The product "065cc1k034" was accessed 2,583 times via the internal search. |
In our example especially the product "065cc1k034" was accessed often via the internal search, compared to other products.
3. How successful are specific search phrases?
In order to evaluate the general success of the internal search we can analyze the metrics and formulas used so far also for each search phrase. For a better overview we differentiate the search phrases by the used language version of the website. This is depicted via the content group "CG 1 - Website Language".
The data table shows the following results:

Reading Example | |
|---|---|
Internal search: Visits with internal search % | In 5,149 search operations the search phrase "jeans" was entered into the internal search field. |
Internal search: Conversion rate %* | In 9.23 % of all visits in which the search phrase "jeans" was entered into the internal search field an order was placed. |
Internal search: Order value Avg* | With this, an average order value of 120.12 Euros was generated. |
3.1 Are there seasonal difference in the usage of search phrases?
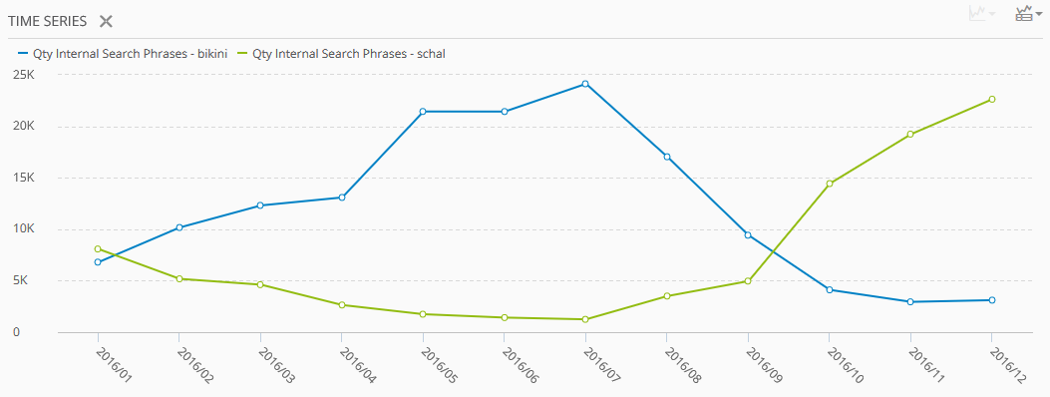
Besides analyzing the total numbers for the analysis time period it is worth to look into the seasonal development of specific search phrases. With doing so seasonal differences in the usage frequency can be identified. This can be easily done by using the time series function.
In the shown example we look at the monthly development of search operations in 2016 (interval months), in which the internal search phrase "bikini" was used, as well as search operations, in which the internal search phrase "schal" ("scarf") was used.
3.2 Which internal search phrases don't provide any use?
Specific internal search phrases may not provide any or only little use for the website visitor. For example, this can be the case, if these phrases deliver only a few or no search results at all. On the other hand, a big amount of internal search results can be counterproductive, too. In order to identify such search phrases, we load several important key figures to the analysis of internal search phrases:
Internal search: Search results per search phrase*: Shows the number of search results per search phrase.
Internal search: Search operations per visit Avg*: Besides the number of search results per search phrase the number of performed search operations in the visit can be an indicator for the quality of the internal search. If it is high, this points to a refining of the search by the website visitor, because perhaps he is not satisfied with the search results.
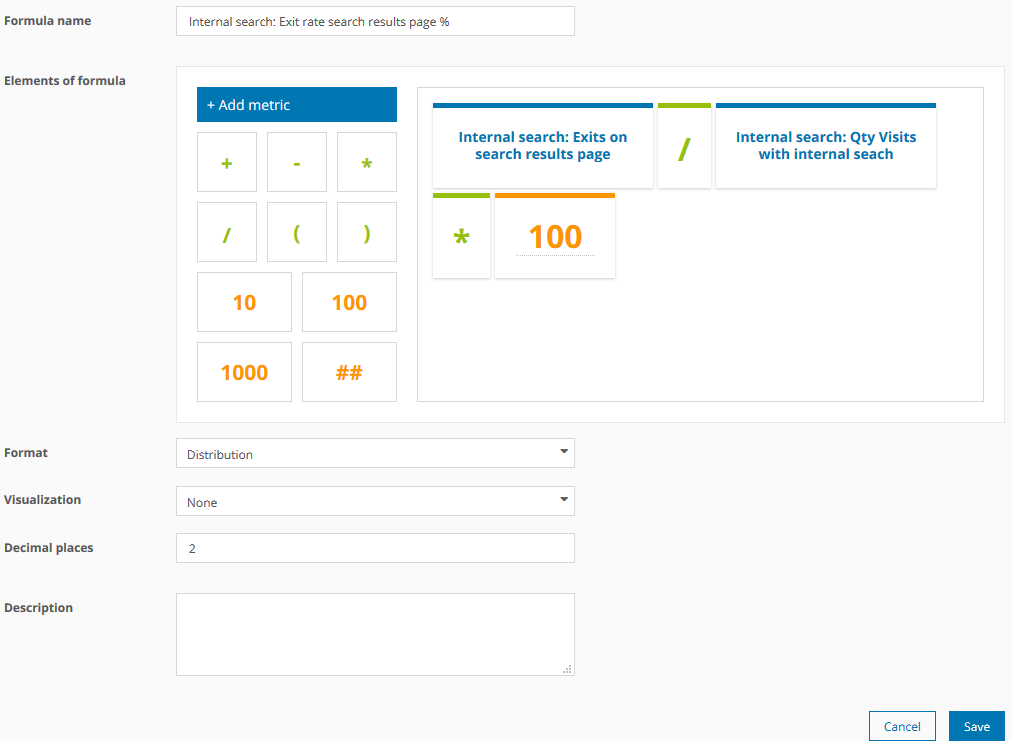
Internal search: Exit rate search results page%*: If the user leaves the website directly after accessing the search results page(s), this can be an indicator for the internal search not being of any help. Accordingly, a high exit rate on the results page(s) can point at an dissatisfying quality of the search results for specific search phrases.
The data table shows the following results:

Reading Example | |
|---|---|
Visits | In 10,195 visits the search phrase "shoes" was used in the internal search. |
Internal search: Search results per search phrase* | On average the internal search for "shoes" delivered 0 search results. |
Internal search: Search operations per visit Avg* | On average 1.02 search operations were performed per visit, in which the internal search phrase "shoes" was used. |
Internal search: Exit rate search results page %* | In 56.21 % of the internal search operations for "shoes" the website visitors left the website directly after seeing the search results page(s). |
For our example the analysis shows, that the search phrase "shoes" is often searched in many visits with an internal search.
However, it doesn't provide any results. Furthermore, it becomes evident, that the users don't refine their internal search, as the average number of search operations per visit is only slightly above 1. As a consequence the exit rate on the search results page(s) is very high: In more than the half of all visits in which "shoes" was searched users exited on the results page(s) of the internal search.
4. How often is the suggested search displayed and used?
In our example scenario, the user is shown search suggestions as soon as at least 3 characters are entered into the internal search field. A redirection to the search results page is done when a suggestion is clicked. A page parameter on the results page submits the information about whether the suggested search was used or not ("Internal Search: Usage of Suggested Search"; for further possibilities of tracking the suggested search see How to track your internal Search optimally).
We now want to look at how often the users of the internal search use the suggested search and how big the share of it is compared to the "organic" search, i.e. the usage of the internal search without clicking on any search suggestions. Both are indicators for the quality of the suggested search.

Reading Example | |
|---|---|
Visits | In 33,888 visits in which the internal search was used the suggested search was used, too. |
Visits % | This equals 60.60 % of all visits with usage of the internal search. |
The data table shows, that in the majority of visits in which the internal search was used, the search suggestions was used, too. Thus, it provides an important orientation for the website visitors.
The specific internal search phrases can be examined with focus on the usage of the suggested search, too. For example it could be analyzed, which internal search phrases are generated mainly via the suggested search and which ones via the "organic" search.
Furthermore, the key figure "Internal search: Search operations per visit Avg" gives the first impression, if the suggested search has an influence on the search operations, that are done per visit with an internal search. If these are reduced by the use of the suggested search function, it can be interpreted as a quality criterion of the suggestions - the user has to refine his search phrases less often, but finds relevant results more often, than without using the suggestions.

Reading Example | |
|---|---|
Visits | In 10,132 visits with use of the internal search with the search phrase "jacket" the suggested search is used. |
Visits % | This equals 67.73 % of all visits with the use of the internal search, in which the search phrase "jacket" was used. |
Internal search: Search operations per visit Avg* | The search phrase "jacket" was used in the internal search on average 1.74 times, when the suggested search was used. |
The data table of our example shows, that the internal search phrase "jacket" is mainly used with the help of the suggested search. This has an influence on the number of search operations per visit with internal search, too: Compared to the internal searches on "jacket" without using the suggested search it is significantly lower than with using the suggested search.
The frequency the suggested search was displayed can be a quality criterion for the suggested search. In case it is only rarely visible for the users, i.e. search suggestions based on their input into the internal search field are only rarely displayed, this can indicate to the potential for optimization. It can be tracked via event tracking when someone performs puts content into the search field and when search suggestions are displayed.

Reading Example | |
|---|---|
Clicks | The search suggestion of the internal search was clicked 41,298 times, when the suggested search was shown. |
Visits | In 33,888 visits, in which the internal search was used, search suggestions were shown. |
Visits % | This equals 60.60 % of all visits, in which the internal search was used. |
In our case, the suggested search was visible in the majority of visits in which the internal search was used.
5. Further possibilities for analyses
This article aims on giving you some first ideas for analyzing the internal search of your website. Obviously, they can be extended arbitrarily. Further possibilities for analyses, for example, could be:
Content groups, preceding pages: From which website subpages and sections is the internal search used? ...
Tracking of events on the search results page(s): How are the internal searches refined? Which elements of the search results are clicked in order to get to the product views. How often are products displayed on the first search result page and than clicked? ...
Tracking of scroll depth on the search results page(s) (plugin): How many search results are viewed at all?
Further ideas can be found in the article How to track your internal Search optimally.
6. Configuration of important key metrics
Custom metrics and formulas have to be set up and configured in order for them to be available globally.
Metrics: Custom Figures > Custom Metrics Formulas: Custom Figures > Custom Formulas
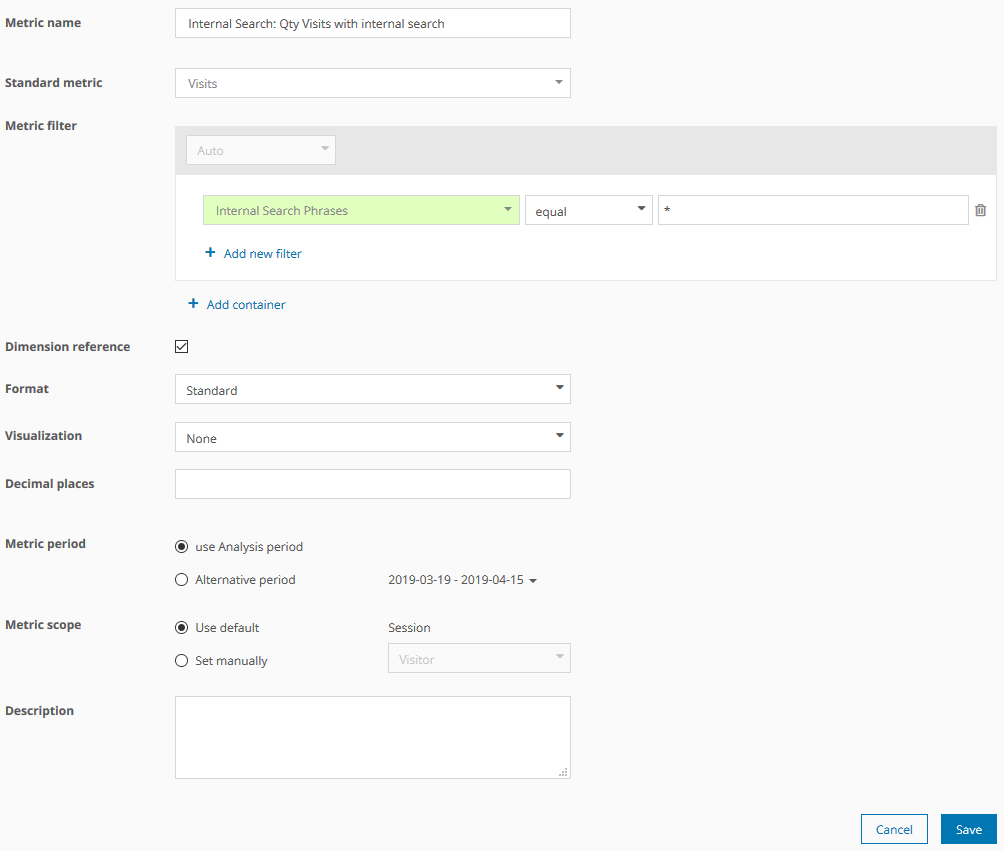
Internal search: Qty Visits with internal search
Shows the number of visits in which the internal search was used.
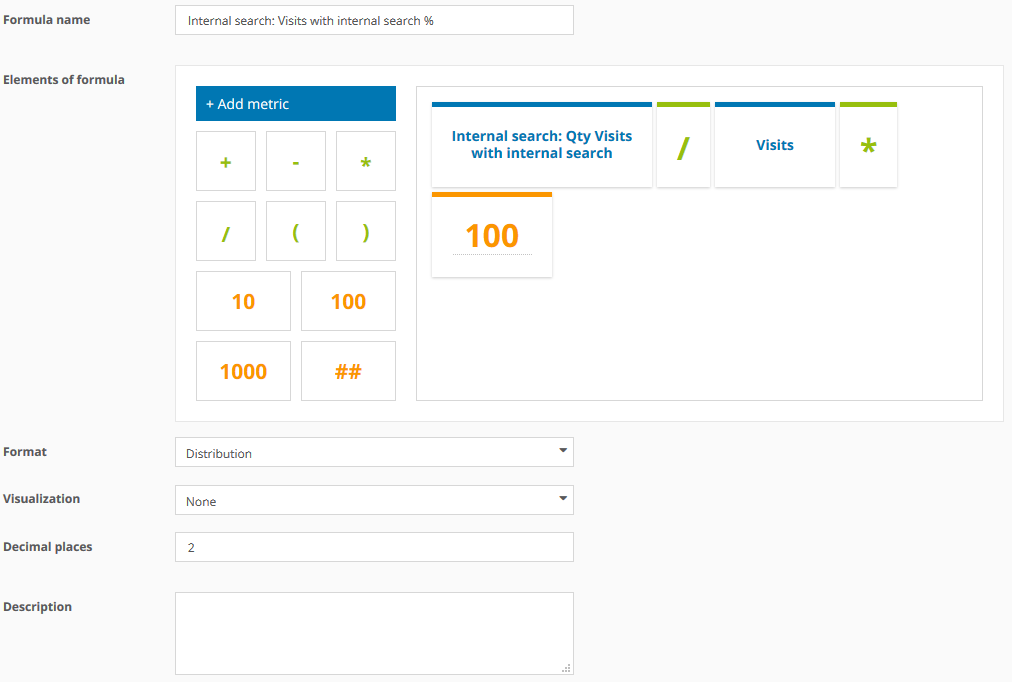
Internal search: Visits with internal search %
Shows the relation of visits with internal search to the total number of visits.
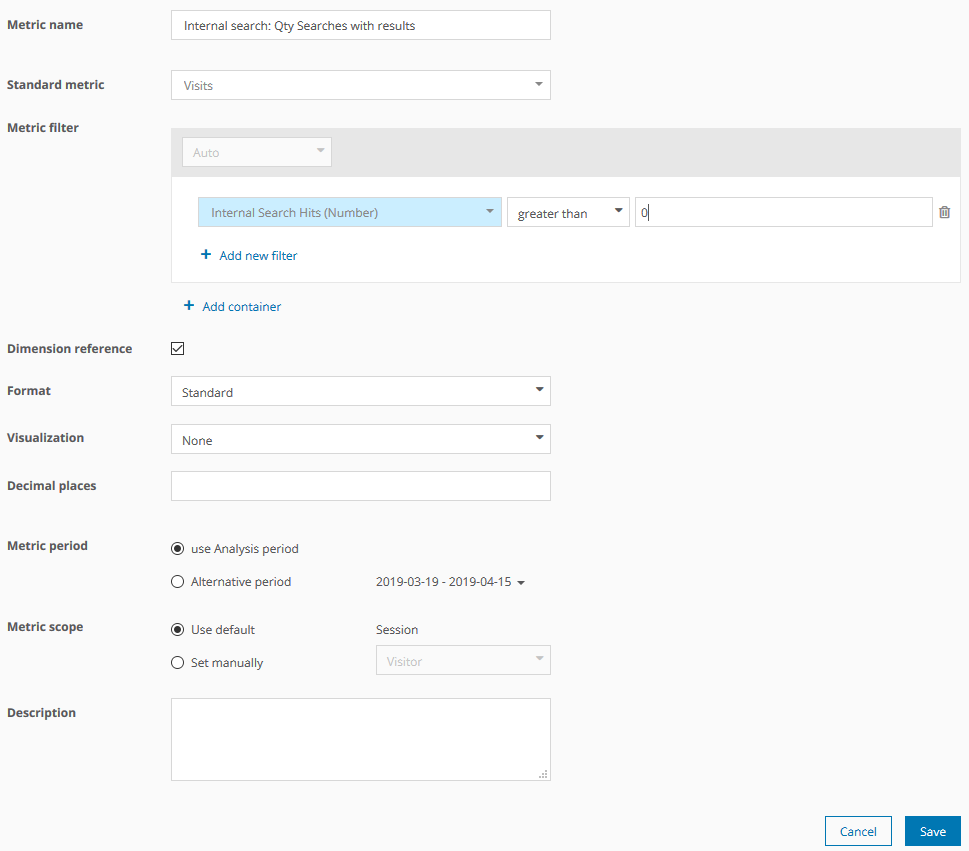
Internal search: Qty Searches with results
Shows the total number of successful internal search operations.
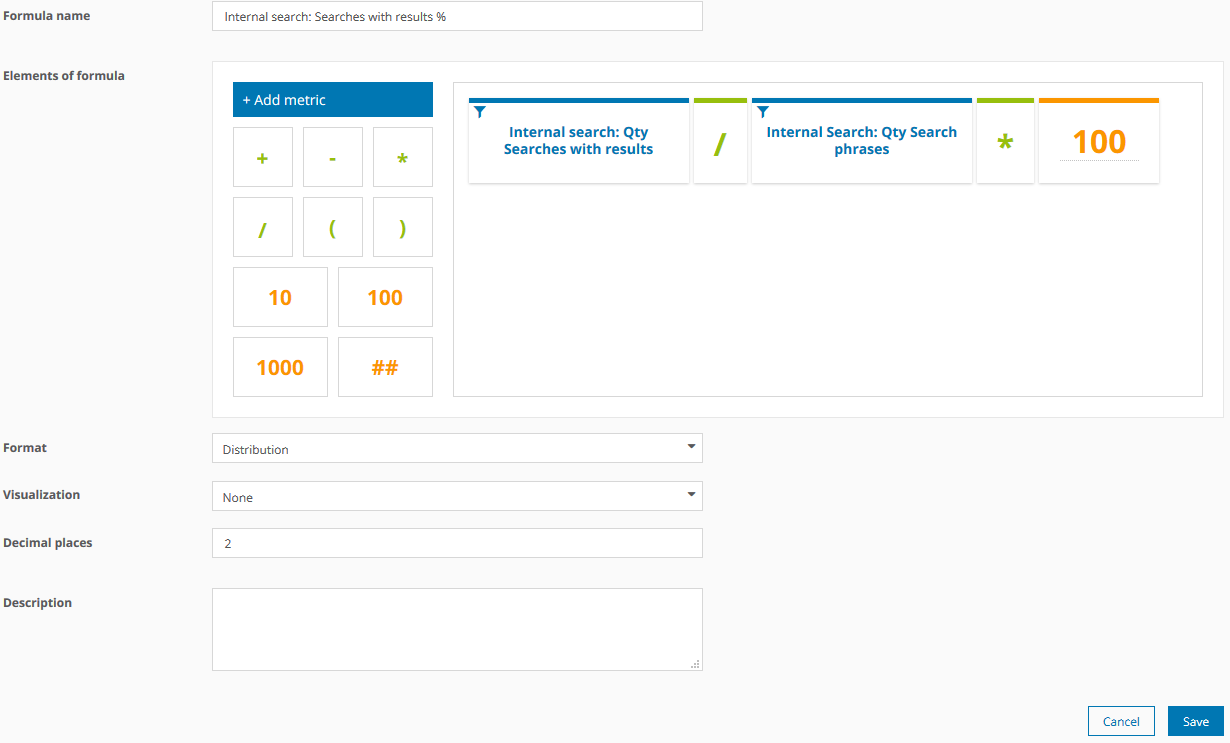
Internal search: Searches with results %
Shows the relation of successful internal search operations to the total number of internal search operations.
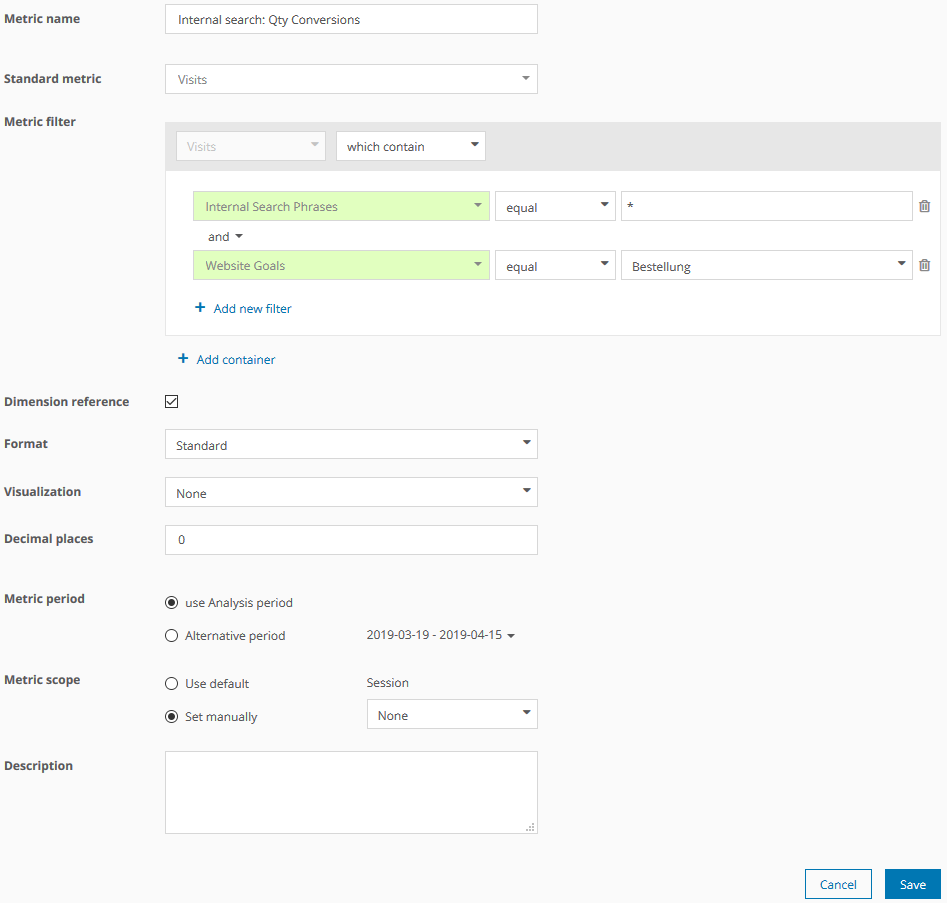
Internal search: Qty Conversions
Shows the number of conversions (in our example orders) of visits in which the internal search was used.
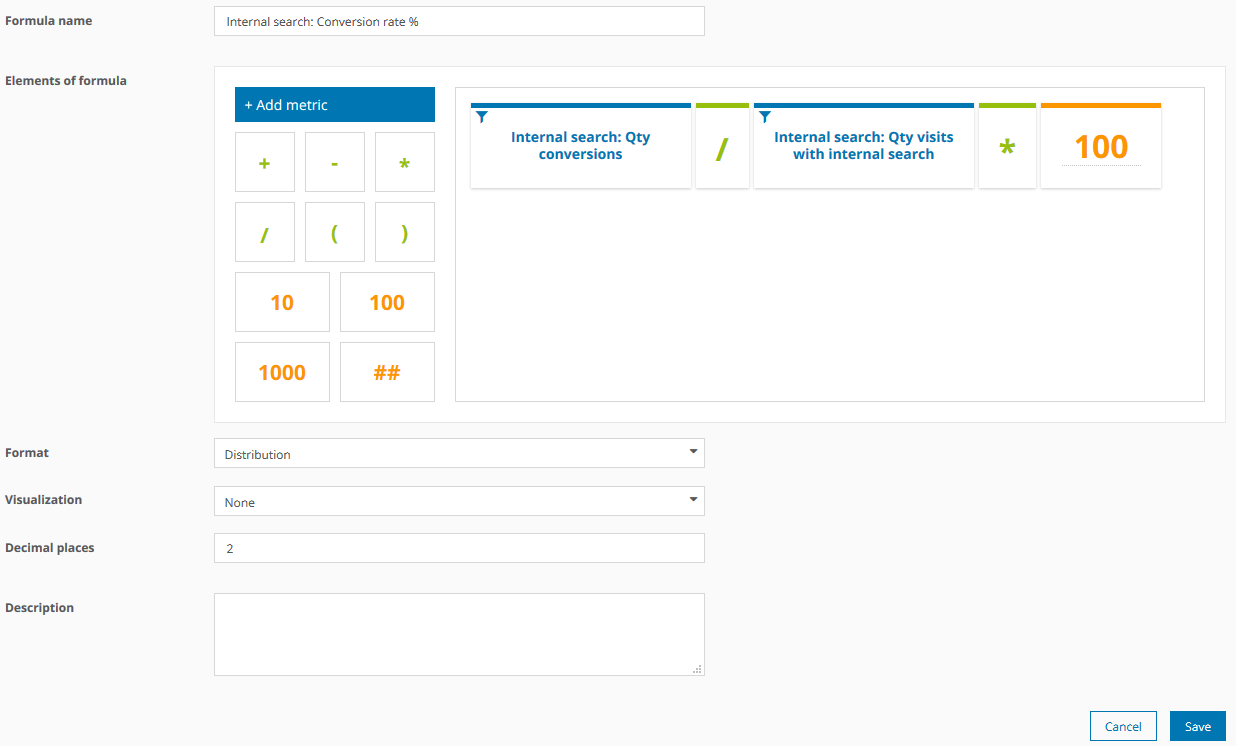
Internal search: Conversion Rate %
Shows the relation of conversions (in our example orders) of visits in which the internal search was used to the total number of visits with internal search.
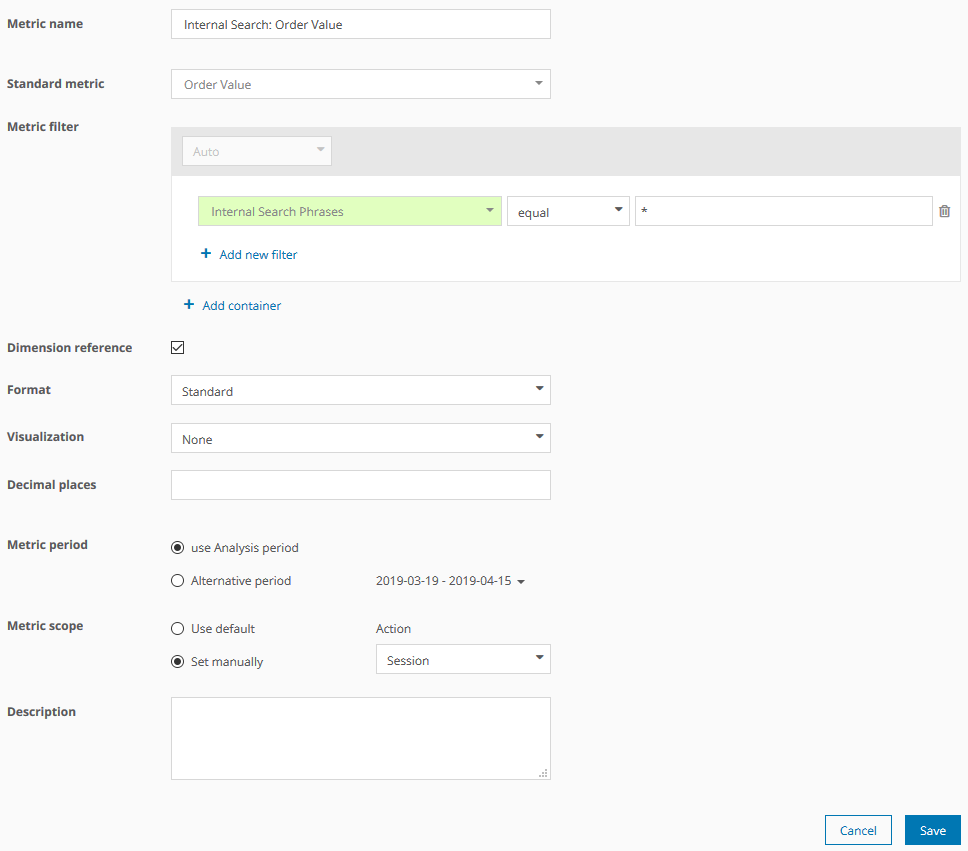
Internal search: Order value
Shows the total order value, that was generated in visits with internal search.
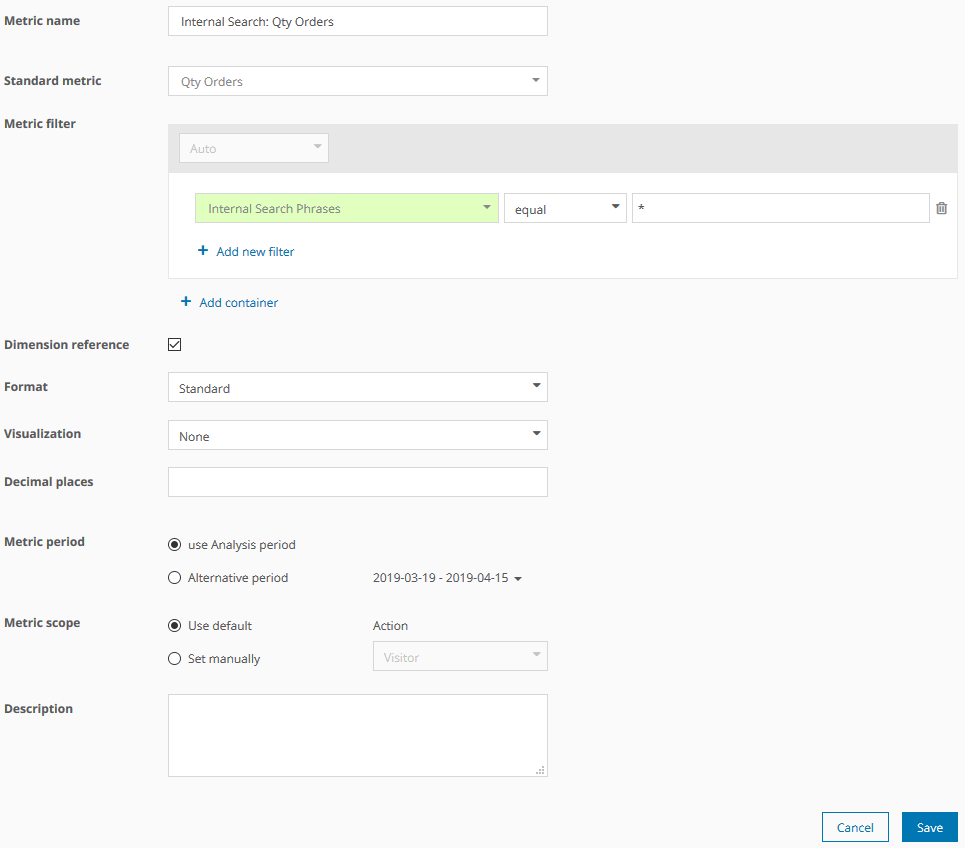
Internal search: Qty Orders
Shows the total number of orders, that were generated in visits with internal search.
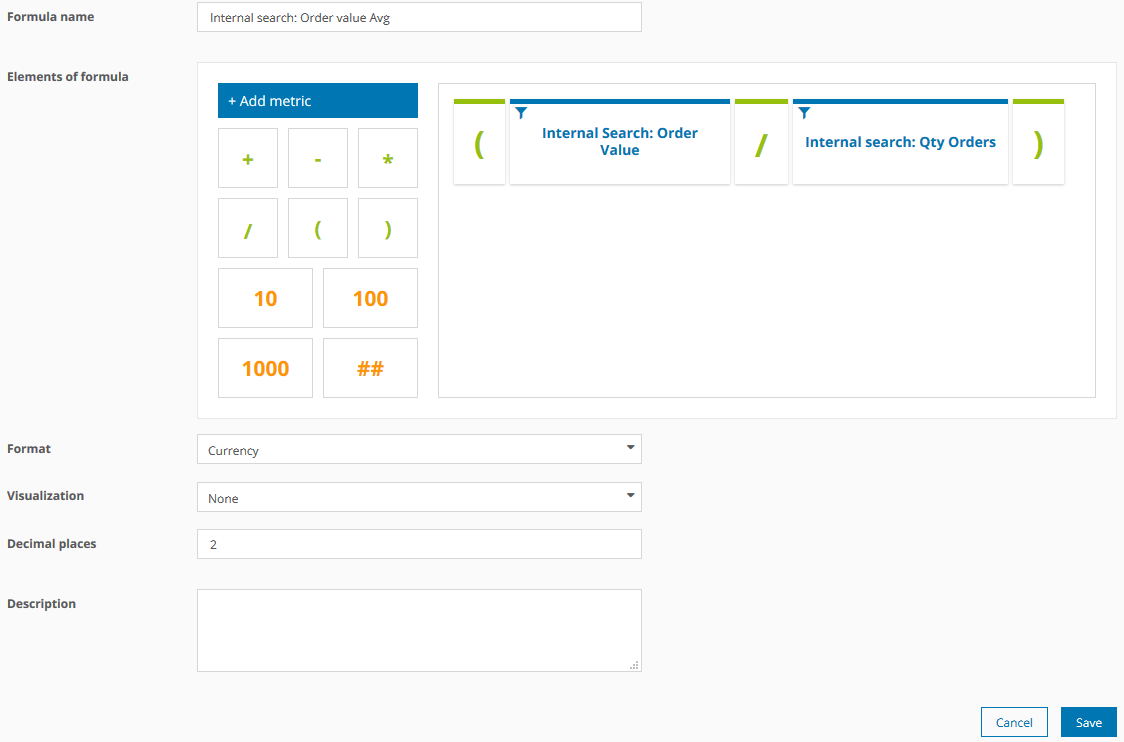
Internal search: Order value Avg
Shows the average order value, that was generated in visits with internal search.
Internal search: Qty Product views
Shows the number of product views, in which the preceding page was a search result page (whose page name in our case contains "catalogsearch.result"). The metric was configured in Mapp Intelligence and is only available in this analysis.

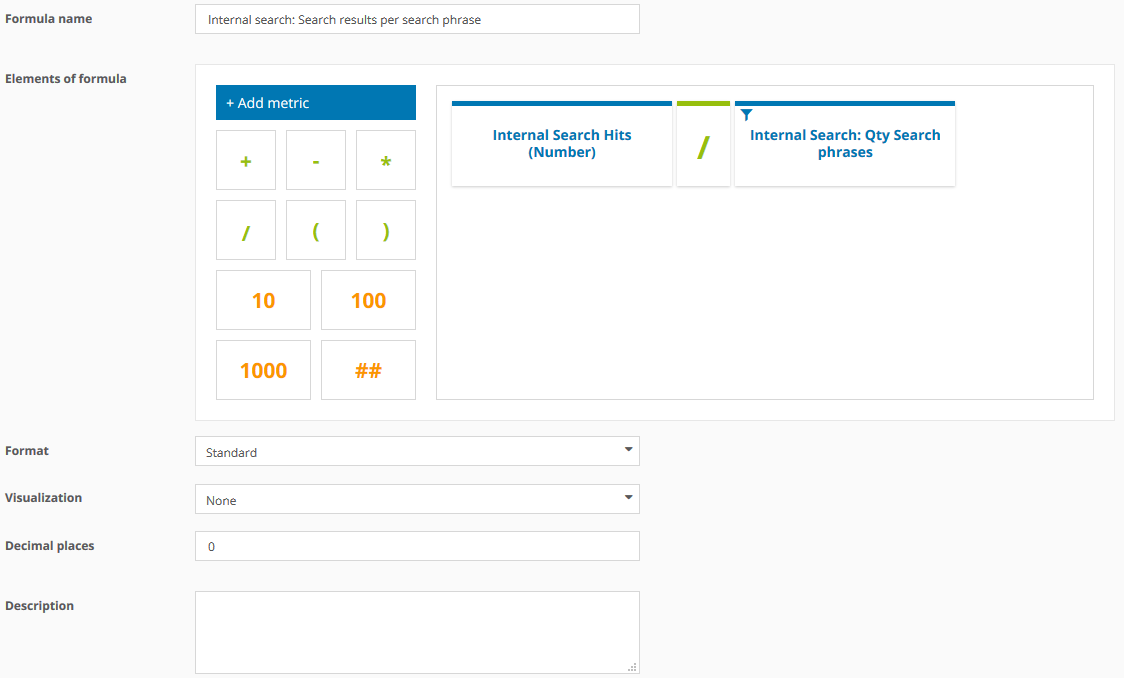
Internal search: Search results per search phrase
Shows the relation of the number of internal search results (tracked on the search result page via the page parameter "Internal Search Hits (Number)") to the number of internal search operations.
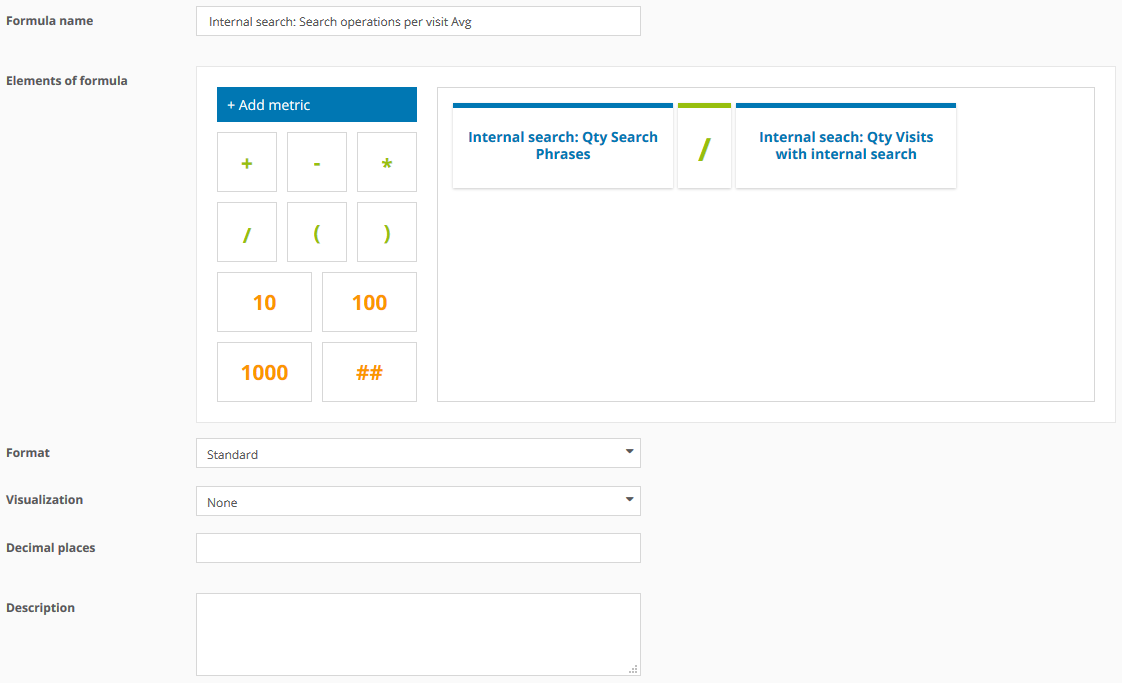
Internal search: Search operations per visit Avg
Shows the relation of the number of internal search operations to the number of visits in which the internal search was used.
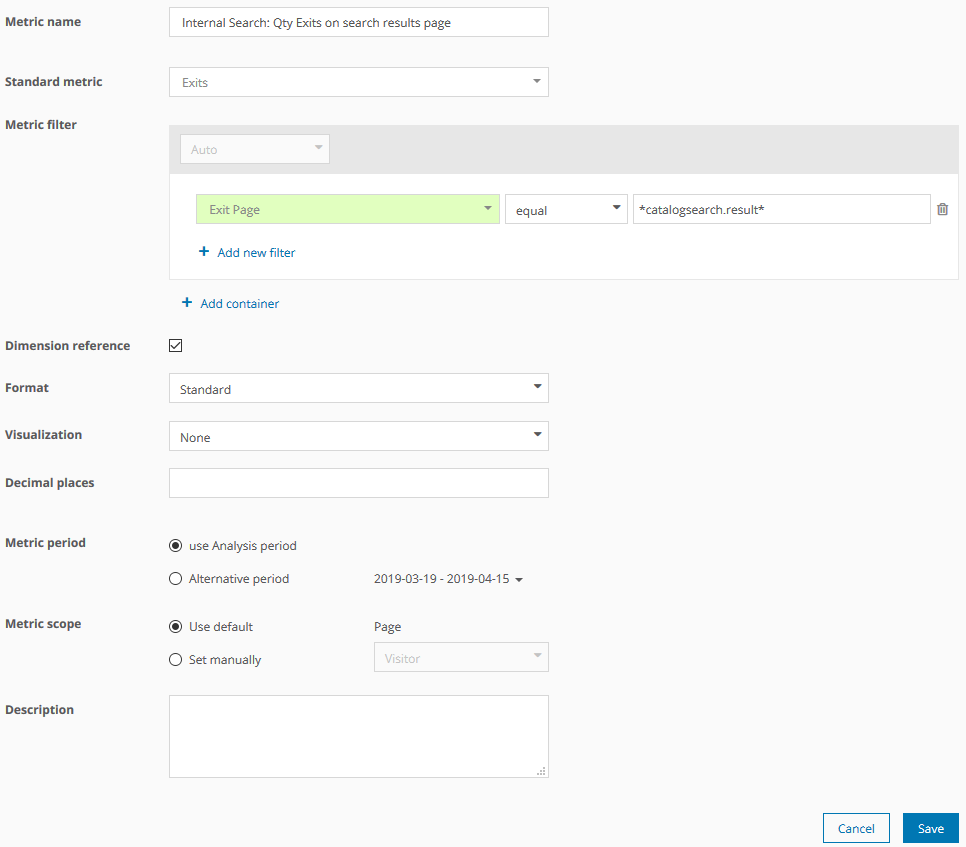
Internal search: Exits on search results page
Shows the number of exits on a search results page (whose page name in our case contains "catalogsearch.result").
Internal search: Exit rate search results page %
Shows the relation of the exits on the search results pages (whose page names in our case contain "catalogsearch.result") to the number of visits in which the internal search was used (and thus a search results page was displayed).
