01 Feb 2022 Great news for all Data Streams users! You can now monitor data flows in all your streams within the Mapp Intelligence interface. This makes it easier to check your overall system health, Data Streams' performance, and to spot potential hiccups.
Key Benefits
With real-time Data Streams monitoring in the Mapp Intelligence interface, there's no need for external systems
System health status informs you at a glance if there has been an outage or other issue
Metrics that help you understand the performance of your data streams
Granular monitoring within data visualization that allows you to immediately spot any anomalies
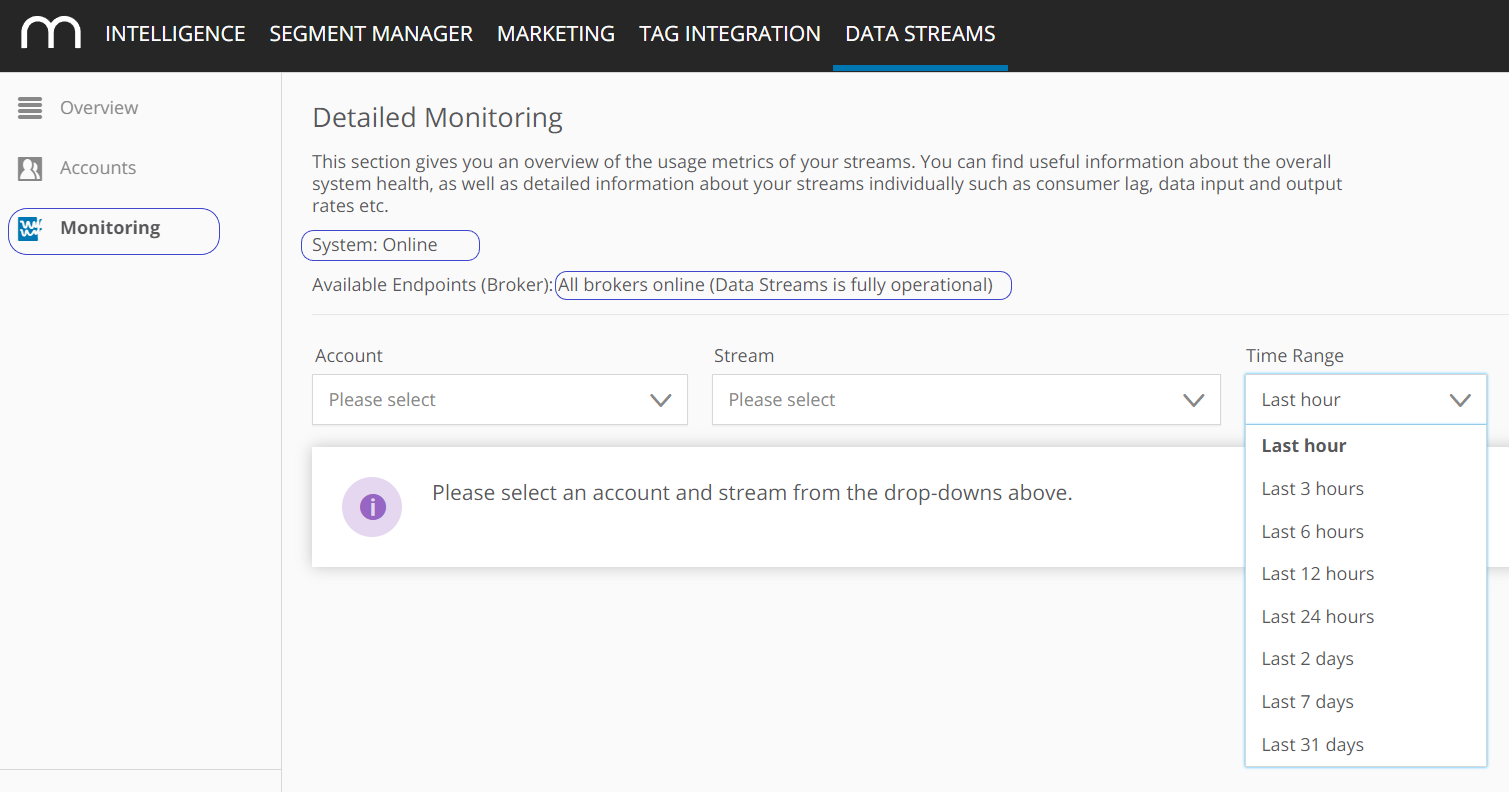
Adjustable time filter, ranging from one hour to 31 days
How does it work?
Go to Data Streams > Monitoring and select the account and stream you want to view. Once there you can:
Check whether the system is working as expected
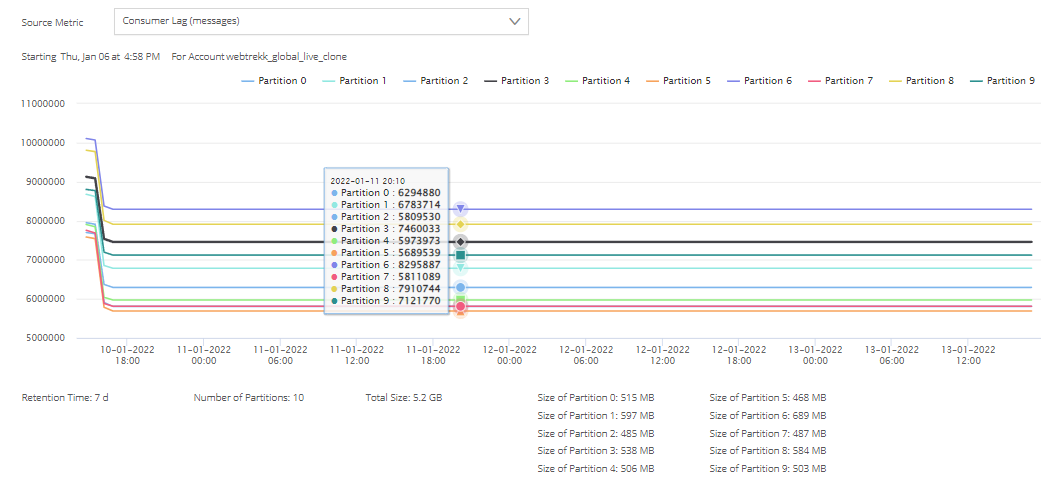
See detailed performance of each partition across a number of metrics:
Data input rates: the amount of data fed into the data stream
Data output rates: the amount of data that your computers are consuming
Processing latency: how long it takes for the data to be ready to be consumed
Consumer lag: the amount of data that has been produced, but not consumed yet
Use data visualization to spot potential anomalies, for example, discrepancies between input an output rates
Availability
This feature is part of our winter update 2022 which went live on February 1st.