Once Recommendation Tracking is collecting data, you can evaluate results directly in Mapp Intelligence.
Analyses help you understand which recommendation widgets perform well and which products contributed to conversions.
Available dimensions
Recommendation Tracking generates two types of dimensions:
Widget context dimensions
based on the predefined E-Commerce parameters (placement, position, algorithm)
Product-level dimensions
based on recommendation display/click events (product + product category)
Dimension | Description |
|---|---|
Algorithm (in reco widget)* | Recommendation algorithm used (for example, similar items). Based on E-Commerce parameter ID 767. |
Placement (in reco widget)* | Where the widget appeared (for example, PDP, homepage). Based on E-Commerce parameter ID 765. |
Yourcategoryname clicked (in reco widget) | Category of clicked products. One dimension per category. |
Yourcategoryname displayed (in reco widget) | Category of displayed products. One dimension per category. |
Products clicked (in reco widget) | Lists products clicked in widgets |
Products displayed (in reco widget) | Lists products shown in widgets |
* These names are customer-defined. The system uses the label you configure when creating the parameter.
Available metrics
Metric | Description |
|---|---|
Qty Products displayed (in reco widget) | How often a product was displayed |
Qty Products clicked (in reco widget) | How often a product was clicked |
Product position (in reco widget)* | Product’s position inside the widget (1, 2, 3 …). Based on E-Commerce parameter ID 766. Useful for filtering and breaking down performance. |
Value products clicked (in reco widget) | Total value of products clicked in widgets. The value is taken from the product price submitted with the click-reco event. |
Value products displayed (in reco widget) | Total value of products displayed in widgets. The value is taken from the product price submitted with the display-reco event. |
* These names are customer-defined. The system uses the label you configure when creating the parameter.
Note: Automatic Qty metrics
For each widget-context dimension, an additional Qty-metric is created automatically (e.g., Algorithm of reco widget → Qty Algorithm of reco widget). These Qty-metrics simply count how often the parameter was passed. They are mainly useful for diagnostics, not for business reporting.
Note: Orders & revenue via filters
To analyze orders or revenue, use standard e-commerce metrics (e.g., Qty purchased products, Revenue) together with filters on recommendation parameters. See examples below.
Example Analyses
These examples demonstrate how to evaluate the performance of your recommendations in Mapp Intelligence. All analyses use data collected via the Recommendation Tracking extension.
In addition to the examples below, many other recommendation-related dimensions and metrics are available. You can freely combine them to explore algorithms, product categories, or audience segments in more depth.
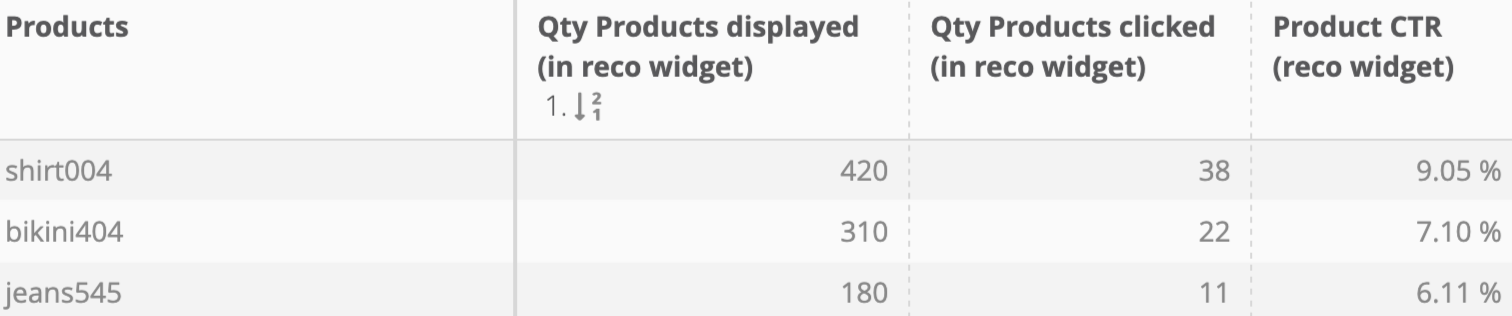
1) Which recommended products receive the most user interaction
Shows which recommended products receive the most attention and clicks.
Use this analysis to identify items with strong engagement potential.
How to build
Dimension: Products
Metrics: Qty Products displayed (in reco widget), Qty Products clicked (in reco widget)
Optional: Create a custom metric (Clicks / Displays) to calculate CTR.
You can use this as a starting point to decide which products should be promoted more prominently.
2) Which recommended products lead to purchases
Highlights products that are not only clicked but also purchased within a seven-day period.
This helps identify items with real commercial impact and shows which recommendations effectively drive conversions.
How to build
Dimension: Products
Metrics: Standard e-commerce KPIs (e.g., Qty Purchased Products, Value Purchased Products)

Filter: Product position (in reco widget). filter for any value
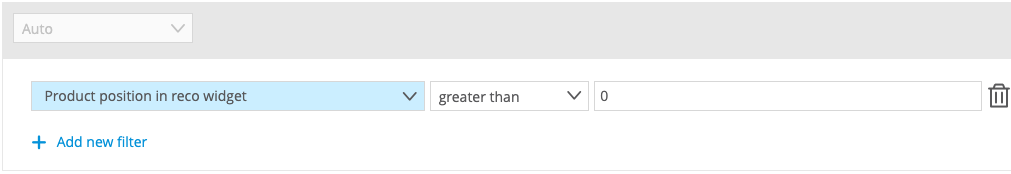
This filter is required because the Products dimension and eCommerce metrics are not specific to recommendations. Filtering by “product position (in recommendation widget)” ensures that only purchased products that were previously tracked as part of a recommendation are included in the analysis.
While other eCommerce parameters can also be used to identify recommendation-based purchases, the product position parameter is the most reliable choice because it is attached automatically whenever a recommended product is clicked and later purchased.
Note
A click-to-purchase connection is recognized if the purchase happens within seven days after the recommendation click.
3) Which widget placements and positions perform best
Shows where recommendation widgets generate the highest engagement and how product position affects results.
How to build
Dimension: Placement (in reco widget)
Metrics: Qty Products displayed (in reco widget), Qty Products clicked (in reco widget)
Optional: Filter or break down metrics by Product position (in reco widget) to compare positions 1, 2, 3 …
Homepage and PDP placements often perform differently. This view helps refine your widget layout strategy.
Advanced option: Add Products in a pivot table to explore which specific products perform best within each widget and position.
4) Which algorithms generate the most effective recommendations
Shows how different recommendation algorithms perform and which products get the most clicks within each algorithm type.
How to build
Dimension: Algorithm (in reco widget)
Metrics: Qty products clicked (in reco widget)
Advanced option: Add Products clicked (in reco widget) in a pivot table to compare product performance across algorithms.