Overview
The Usage Statistics section provides an overview of system usage and quotas. It allows you to review key performance indicators (KPIs), analyze usage trends over time, and export usage data for further analysis.
This section helps you monitor system activity and ensure that usage remains within defined limits.
Navigation Path
Administration > Usage Statistics
Available Information
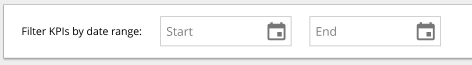
Use the date filter to see the relevant data.
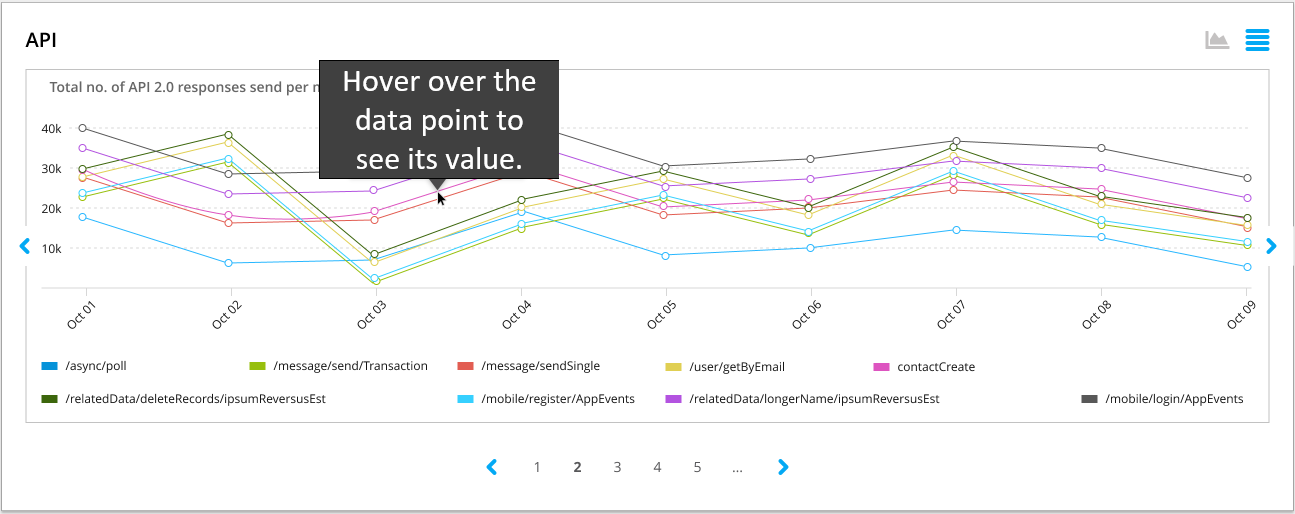
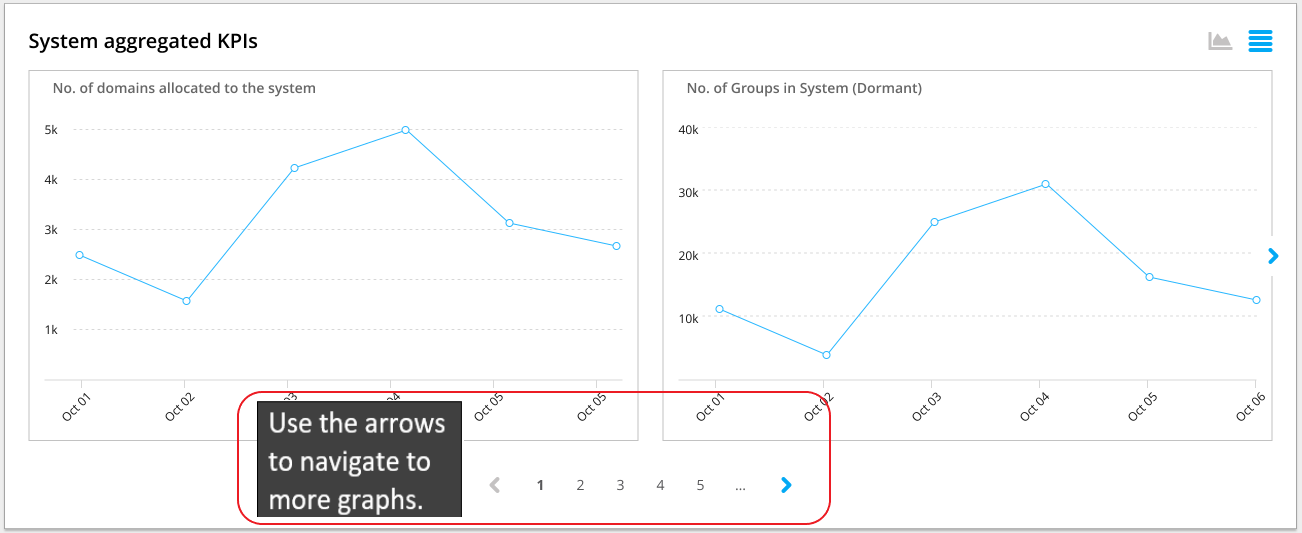
Graphs update according to the dates you select. There are a variety of graph types available to represent your data meaningfully.
You can export your data to a raw CSV file by pushing the Export CSV button.

Examples