Predictions are part of the Mapp AI package and are used to make forecasts based on user behavior.
What is the likelihood that a specific visitor will never return to the website?
What is the likelihood that a specific visitor will buy something during one of the subsequent visits?
What order value will a specific visitor generate with his next order/in the next 30 days/lifetime?
This information is relevant to derive individual marketing measures.
The costs of marketing measures should not exceed the expected profit.
Only spend money on customers with high potential!
A self-learning system continuously analyses influences and considers them for calculation.
The system is configured individually for each customer.
In the first 2-3 months, in particular, the predictions are automatically adapted on a customer-specific basis.
Various criteria are analyzed:
Number of visits
Number of orders
Purchases/visit
Visit duration Avg
Page impressions/visit
Product views/visit
Value of product views/visit
Order value Avg
Order value
Days since first/last visit
Days since first/last purchase
…
The following prediction metrics and dimensions are available:
Available as | ||||
|---|---|---|---|---|
Metric/ | Label | Description | Metric | Dimension |
Churn Probability | User – Predicted Churn Probability % (interval 10) | Indicates how high the probability is that a visitor will not revisit the website. | X | |
User - Predicted Churn Probability % | X | |||
Conversion Probability | User – Predicted Conversion Probability % (interval 10) | Indicates how high the probability is that a visitor will buy during one of the subsequent visits. | X | |
User – Predicted Conversion Probability % | X | |||
Order Value | User – Predicted Order Value Next 30 Days | The predicted order value that a user will generate in the next 30 days. | X | |
User – Predicted Next Order Value | The predicted order value that a user will generate in his next order. | X | ||
Customer Lifetime Value | User – Predicted Customer Lifetime Value (interval 50) | The predicted order value that a user will generate in addition to the already measured order value. | X | |
User – Predicted Customer Lifetime Value | X | |||
To calculate the churn probability, all needed is for each page to be tracked in Mapp Intelligence.
To calculate the other probabilities, orders, and products have to be measured as well.
Calculating the churn probability
Example:
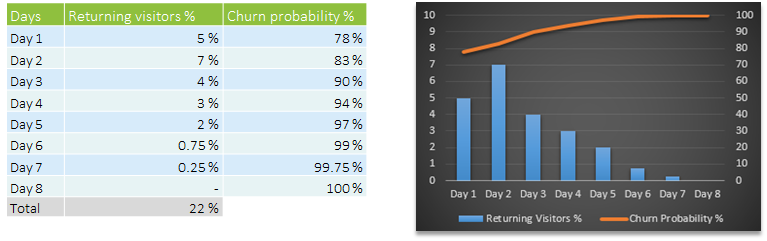
Day 1
Five percent of visitors return to the website on the day of the first visit.
The churn probability on day 1 is: 100 % – sum of all returning visitors (Day 1 – Day 8) = 100 % - 22 % = 78 %
Day 2
Seven percent of visitors return to the website one day after the first visit.
The churn probability on day 2 is: 100 % – sum of all returning visitors (Day 2 – Day 8) = 100 % - 17 % = 83 %
The overall churn probability considers when visitors were last active on the website.
Individual behavior patterns are now considered in the calculation.
For example:
Visit duration Avg
Page impressions / visit
Number of visits
…
For example, if there were ten page impressions during the first visit, only visitors with a similar number of page impressions would be included in the calculation.