Effectively tracking returns is crucial for understanding the true profitability of your products. By integrating return data at the product level, you can calculate net revenue and gain deeper insights into how returns impact overall sales performance.
With this data, Mapp Intelligence enables you to:
Analyze the net revenue generated by specific products, factoring in returns.
Enhance your product performance analysis by including both revenue and return metrics.
Leverage the new Return Value metric alongside existing metrics to gain a more accurate picture of your sales effectiveness.
This guide explains how to set up the import process to track returns at the product level, allowing you to optimize your analyses and reporting.
Step 1: Set Up the E-Commerce Parameter
Before importing data, a predefined parameter needs to be set up to capture return values and link them to individual products.
Navigate to Mapp Q3 > Configuration > Custom Parameters > E-Commerce Parameter > Create New Custom Parameter.
Under Preconfigured, select “Return Value”.
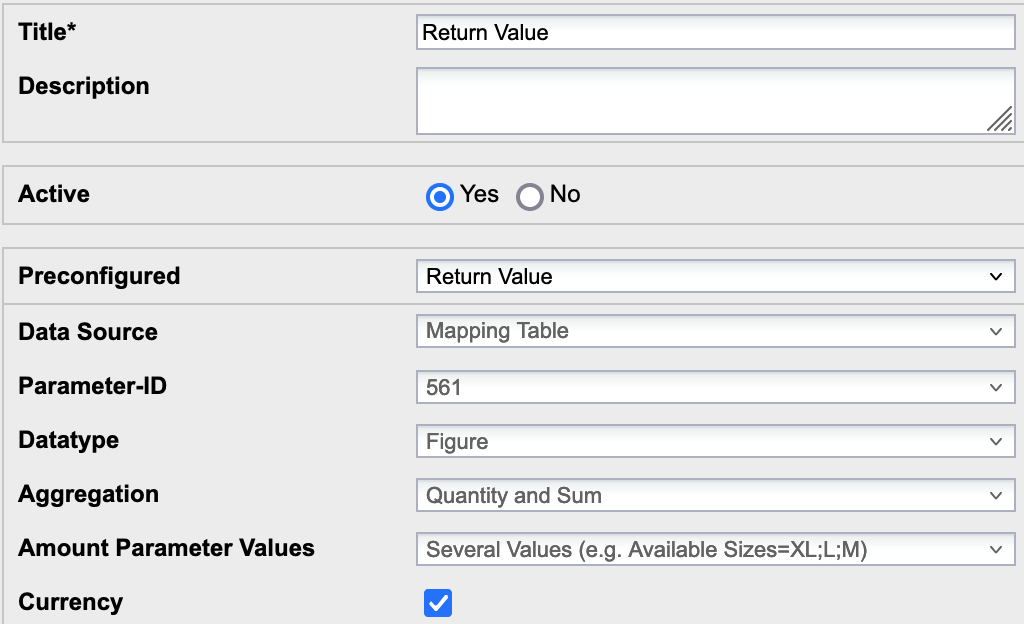
This configuration allows you to track returns at both the order and product levels.
Step 2: Import Return Data
There are two main methods for importing return data: automated data feed (recommended) and manual import using an Excel file.
Import via Data Feed (Recommended)
The primary method for importing return data is through a data feed, allowing for automated and flexible updates. Follow these steps:
Set up the data feed:
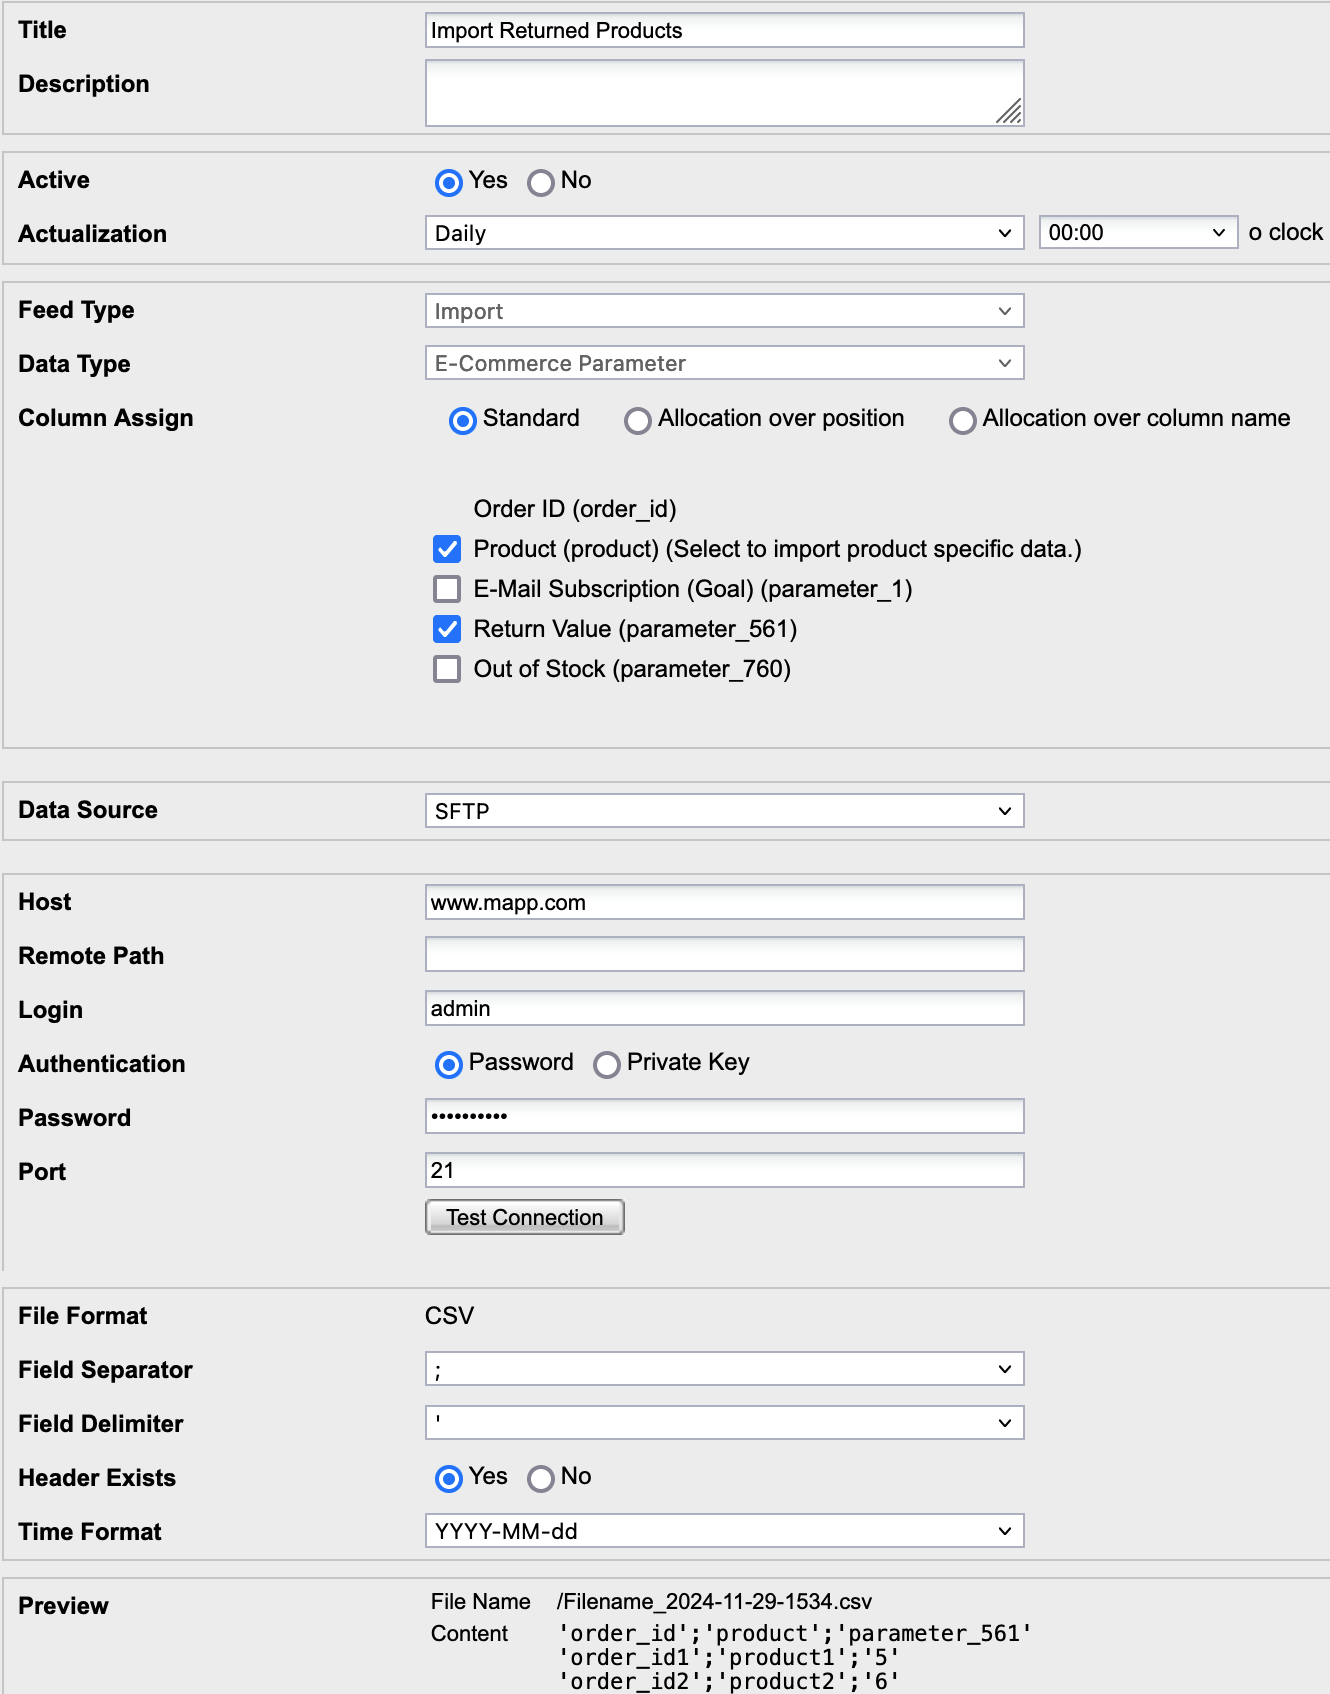
Navigate to Mapp Q3 > Configuration > Feeds > New Feed.
Enter a title (e.g., “Import Returned Products”).
Choose the Actualization frequency:
Daily (used in our example), or alternatively, set it to Hourly or One-Time based on your needs.
Set Feed Type to Import and Data Type to E-Commerce Parameter.
Next, select the specific e-commerce parameter (“Return Value”) created in Step 1.
Assign columns:
Under Column Assign, map the columns to the Order ID, Product ID, and Return Value.
Configure the file location:
Upload the data file to a server and provide the necessary server path and authentication credentials.
Prepare the CSV file:
Ensure the file is in CSV format with the following structure:
'order_id';'product';'parameter_561' 'order_id1';'product1';'4' 'order_id2';'product2';'1' 'order_id3';'product3';'0' 'order_id4';'product4';'4' 'order_id5';'product5';'1'This example helps you understand the structure required for the import.
Alternative: Manual Import via Excel
For testing or occasional use, you can also import data manually using an Excel file. This method is primarily for experimentation and is not recommended for daily updates.
To access the manual import feature, go to “Import and Export” in the configuration layer of the e-commerce parameter. Here, you can export the existing order IDs along with associated products for a selected timeframe and then re-import your modified file.
Learn more on this page: How to Import Time Categories in Mapp Intelligence?
Step 3: Analyzing Return Data for Net Revenue and Product Insights
Once the return data is successfully imported, you can leverage it in Mapp Intelligence to gain deeper insights into your product performance and net revenue calculations. The imported data allows you to analyze how returns affect your overall revenue, helping you make informed business decisions.
Watch the following Use Case Video for more information
Visit this page for more details: Net Revenue and Target Tracking for Better Insights
Key Metric Available for Analysis
Return Value:
This metric tracks the monetary value of returned products, providing a counterpart to the existing “Value Purchased Products” metric.
It can be used to calculate net revenue by subtracting returns from total sales, giving you a clearer picture of actual revenue generated.
Practical Use Cases
Net Revenue Calculation:
By using the “Return Value” metric in conjunction with “Value Purchased Products,” you can easily calculate your net revenue for a specific period. Additionally, you can create a custom formula for this calculation, save it, and make it available as a new metric called “Net Revenue” for future reporting and analysis.
This insight helps in evaluating the profitability of products and marketing campaigns.
Product Performance Analysis:
Integrate the return metric into your product analysis to understand the impact of returns on individual product profitability.
Use these insights to adjust inventory, optimize product lines, or refine marketing strategies.
Example Analysis:
Suppose you want to assess the net revenue generated by a specific product category:
Create a report in Mapp Intelligence using the following metrics:
Value Purchased Products
Return Value
Net Revenue (calculated as Value Purchased Products minus Return Value)
Filter the report by product category to see which products are generating the most revenue after accounting for returns.