Navigation Path
Statistics > Group Messages > In-App Messages > View Statistics
General Information
This window shows aggregated key performance indicators (KPIs) for your In-App messages.
What can I do in this window?
Evaluate delivery performance and recipient activity.
See how many In-App messages were sent.
See how many contacts immediately clicked the push notification per device.
See how many contacts opened the app that is associated with the push notification during the 12-hour time period immediately after the notification sendout. This number is calculated per device.
Total and Unique counts
Most metrics are provided as both Total and Unique counts.
Total counts are calculated regardless of the number of action repetitions per single message/user relation.
Unique counts: clicks, dismisses, read, and unread messages are counted by filtering the customer_ID.
One In-App message can be sent multiple times to one contact. This depends on the frequency defined in the message sendout settings.
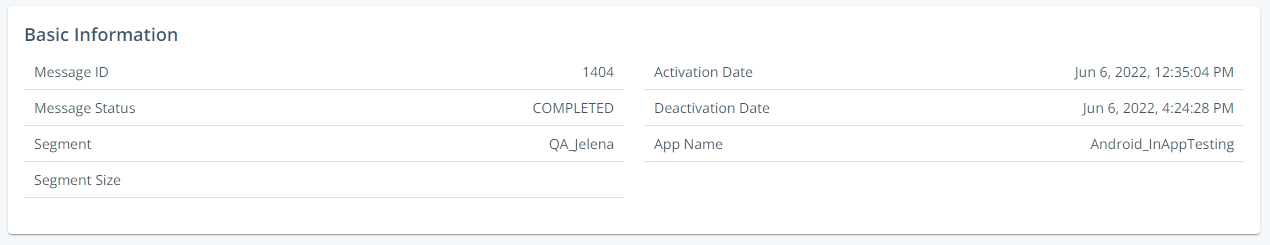
Basic Information Panel
Information | Description |
|---|---|
Message ID | Shows the unique message ID that is assigned to each message in the Engage system. |
Message Status | Shows one of these statuses:
|
Segment | The name of the segment to which the message was sent. |
Segment Size | The size of the segment at the time of sendout. |
Activation Date | Date and time of activation. |
Deactivation Date | Date and time of deactivation. |
App Name | Shows the name of your mobile app. |
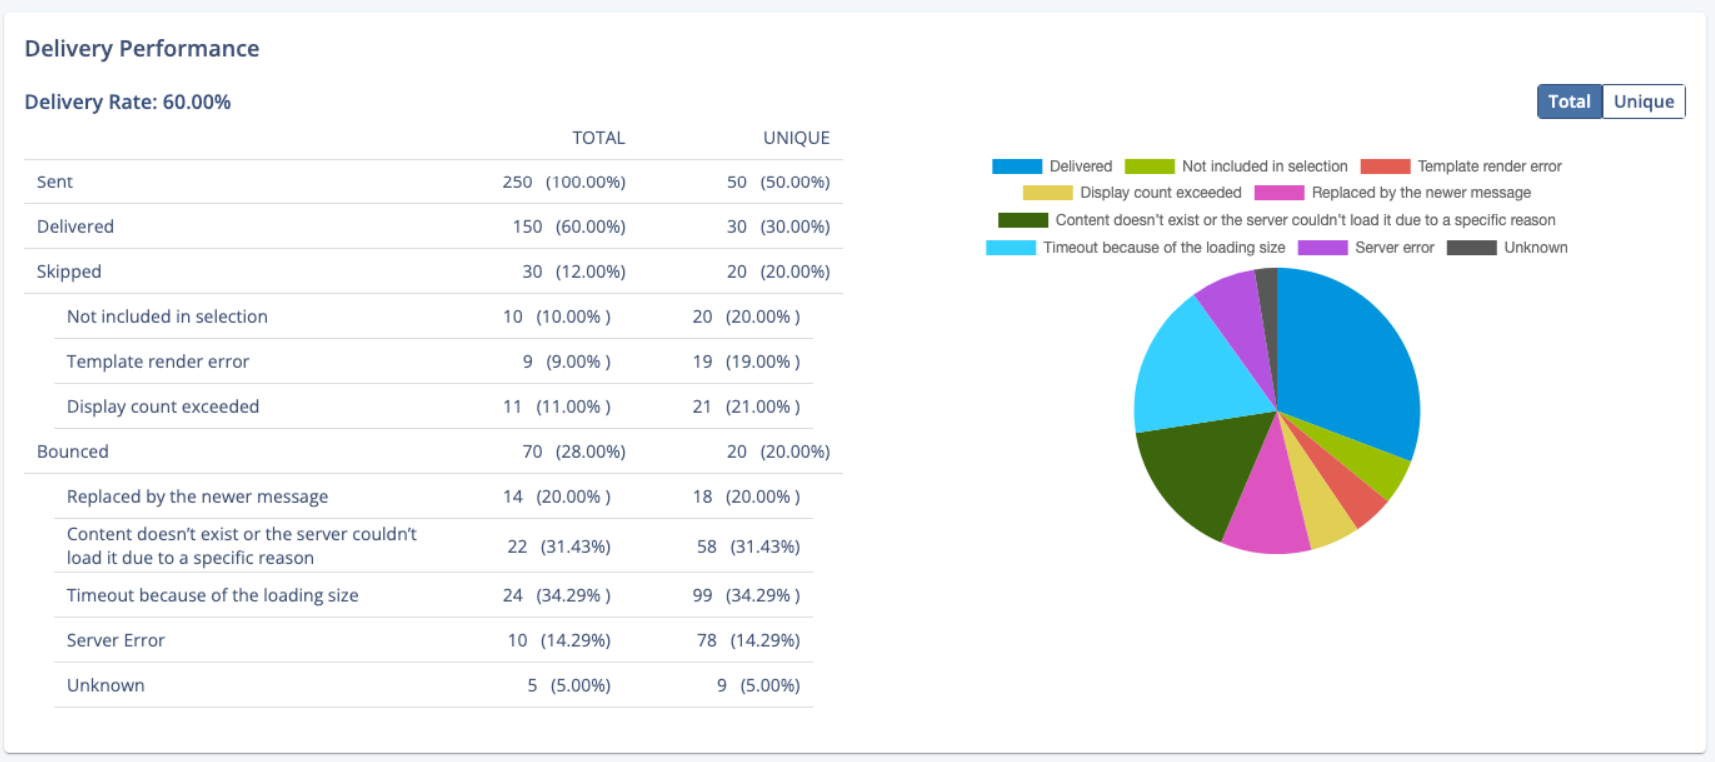
Delivery Performance Panel
This section provides a summary of sendout-specific information for your In-App Message. You can also filter the graph by total and unique counts.
Metric | Description | |
|---|---|---|
Delivery Rate | The overall percentage of messages that were delivered to contacts.
| |
Sent | All messages that were sent.
The maximum value is Segment Size * Frequency of message. Each message can be shown multiple times, depending on message sendout settings. | |
Delivered | All messages that had a server response for success. | |
Skipped | All messages with unsuccessfully processed responses:
| |
Bounced | All messages with server error responses:
|
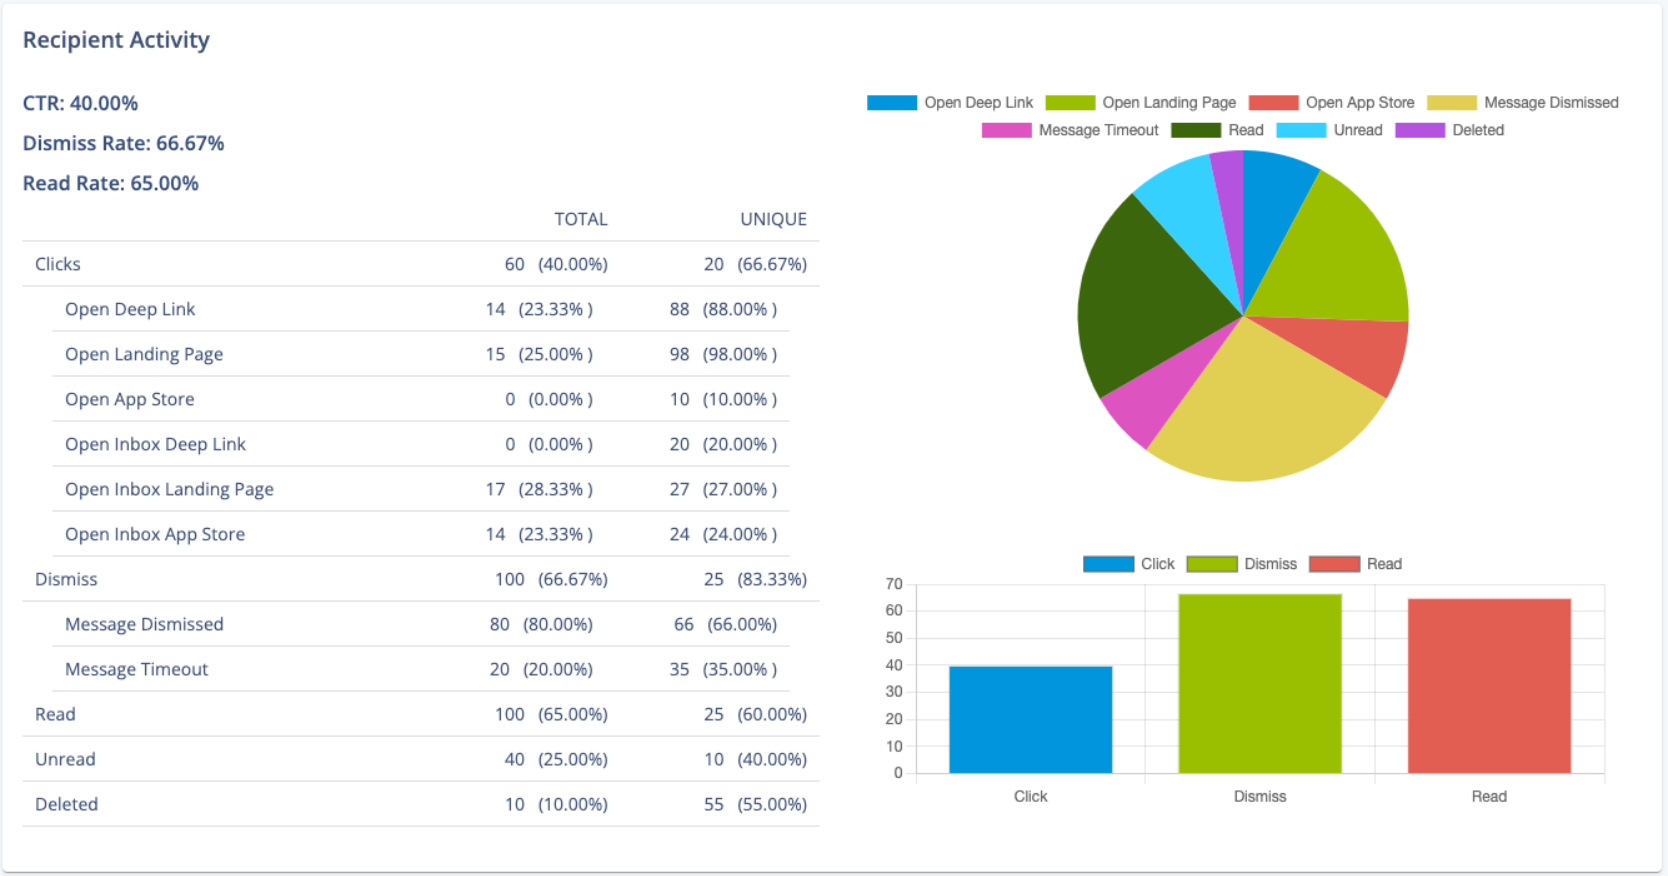
Recipient Activity Panel
Metric | Description | |
|---|---|---|
CTR | CTR stands for Click-through rate.
| |
Clicks | Displays the number of single messages that were clicked. If a recipient clicks a message more than once, this counts only one time.
| |
Dismiss Rate |
| |
Dismiss | Displays the number of single messages that were dismissed. If a recipient dismisses a message more than once, this counts as only one time.
| |
Read Rate |
| |
Read | Displays the number of single messages that were read. If a recipient reads a message more than once, this counts as only one time. | |
Unread | Displays the number of single messages that were not read. | |
Deleted | Displays the number of single messages that were deleted. |