Here you can create custom formulas for the chosen account.
Further information on creating custom formulas can be found in the training chapter on Custom Figures.
Description
Formula name
The name of the custom formula. You may only use a name that is not a name of another custom metric or formula.
Elements of formula
Click on elements the corresponding elements to use them in the formulas. You may use:
Predefined metrics: Can be edited within a formula. The adapted metric is only available within this formula.
Custom metrics: Can be edited within a formula. The adapted metric is only available within this formula.
Predefined formulas
Custom formulas
Operators
Numbers
Format
Here you can adapt the output of the result in the data table.
Standard: The result is not formatted.
Time: The result is displayed in the format [hh:mm:ss].
Currency: The currency symbol set in the system configuration is added.
Distribution: The symbol "%" is added.
Comparison: The symbol "%" is added.
Visualization
Within the data table, different visualizations can be helpful when interpreting data.
None
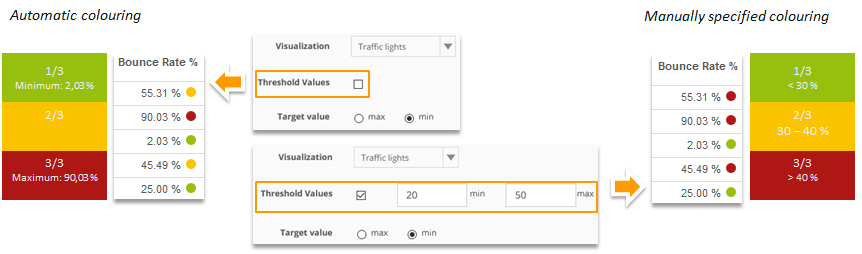
Traffic lights: Shows a red (=bad), green (=good), or yellow (=medium) dot. The colours are chosen automatically based on the actual values of the formula; anyway, you can also adapt the value ranges for the colours (see "Threshold values").
Heatmap: Shows five differently bright blue tones. The darker the colour, the better the value.
The colours are chosen automatically based on the actual values of the formula; anyway, you can also adapt the value ranges for the colours (see "Threshold values").
Bars
Threshold Values
(only available if you choose Traffic lights or Heatmap)
The colours are chosen automatically based on the actual values of the formula. This can be adapted here.
Example: Automatic vs. manually specified colouring
Target Value
(only available if you choose Traffic lights or Heatmap)
Defines whether the target is preferably high or low value.
Max: Using Traffic lights, high values are green and low values are red. Using Heatmap, high values are dark blue, and low values are light blue.
Min: Using Traffic lights, high values are red and low values are green. Using Heatmap, high values are light blue and low values are dark blue.
Decimal Places
Defines how many decimal places are put out. If "0" is set, values are rounded off. If no decimal places are set, the values are not rounded off.
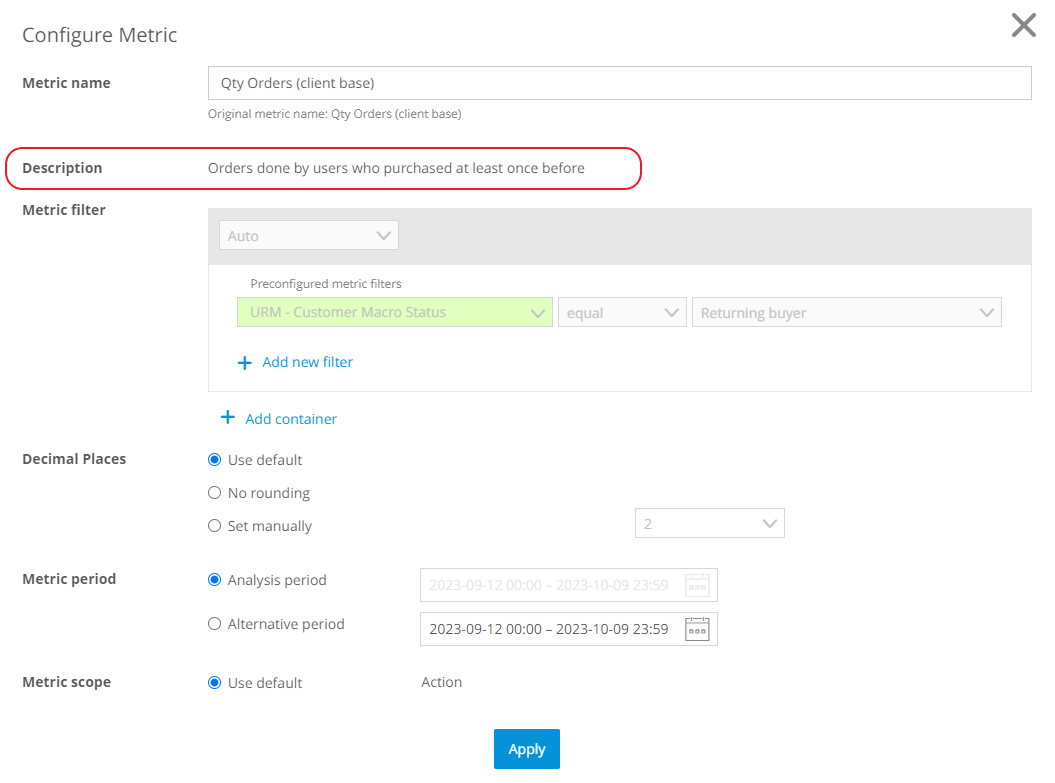
Description
The description is shown in the overview of custom formulas, and in the Configure Metric window:
.png "grafik(5).png")