This article shows you, how to track the usage of ad blockers.
Preface
The tracking of the use of ad blockers can be useful, especially for websites using advertisements and/or remarketing pixels.
For quick integration, Mapp provides a plugin. It is is available in Tag Integration. Alternatively, it can be added as a separate JavaScript file in the standard pixel.
Please note: The tracking does not work in apps.
Step 1: Setting up the parameter
As a first step, the session parameter, in which the information about the ad blocker use is stored, has to be defined in Mapp Q3 > Configuration > Custom Parameters > Session Parameter.
For doing so, choose Create new Custom Parameter and then at Preconfigured, choose Adblocker. We name the parameter "Adblocker usage".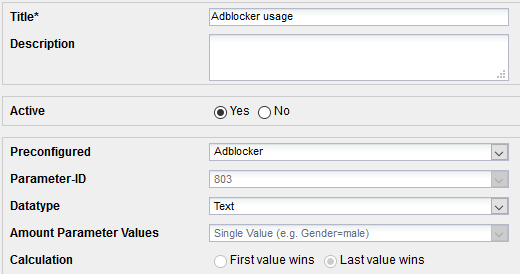
It is a session parameter, for which the last value wins. This means in our case: If a user de-/activates the ad blocker during a visit, only the state, that was measured last, is depicted.
Step 2: Activation in Tag Integration
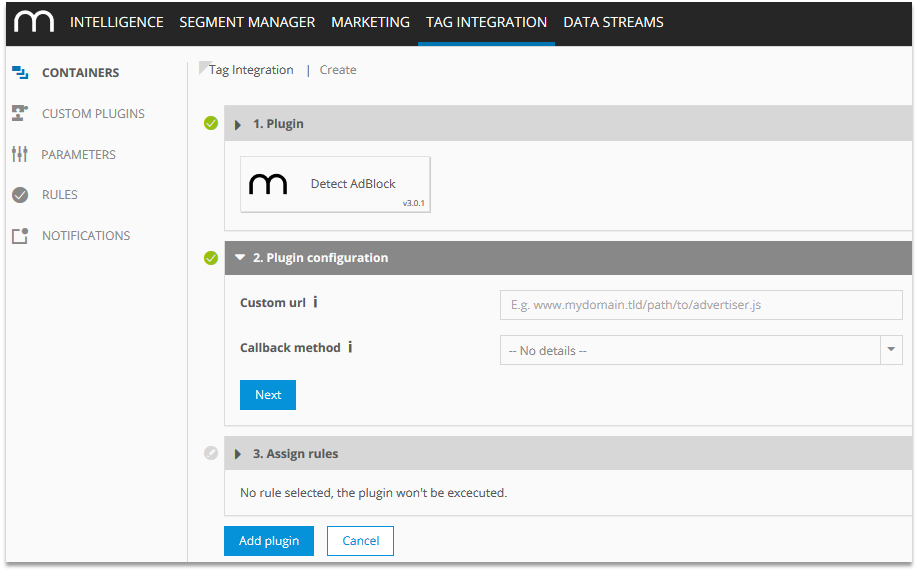
Integrate the plugin "Detect AdBlock" in the container, in which the website to be tracked is stored.
The plugin works as follows:
Mapp stored a JavaScript file on a webserver. The detailed path is: http://advertiser.wbtrk.net/js/advertiser.js
The file is labelled in such a way, that all relevant ad blockers block it.The plugin measures, how often the file is blocked.
Optionally, the file can be stored on an own server. Further information on doing so can be found in the help of Tag Integration.
The only configuration, that has to be done, is in the section "Assign rules": Here you select, in which areas of the website the measurement should happen.
Step 3: Setting up a custom formula
For a later analysis a series of figures is useful, that we set up at Custom Figures > Custom Formula.
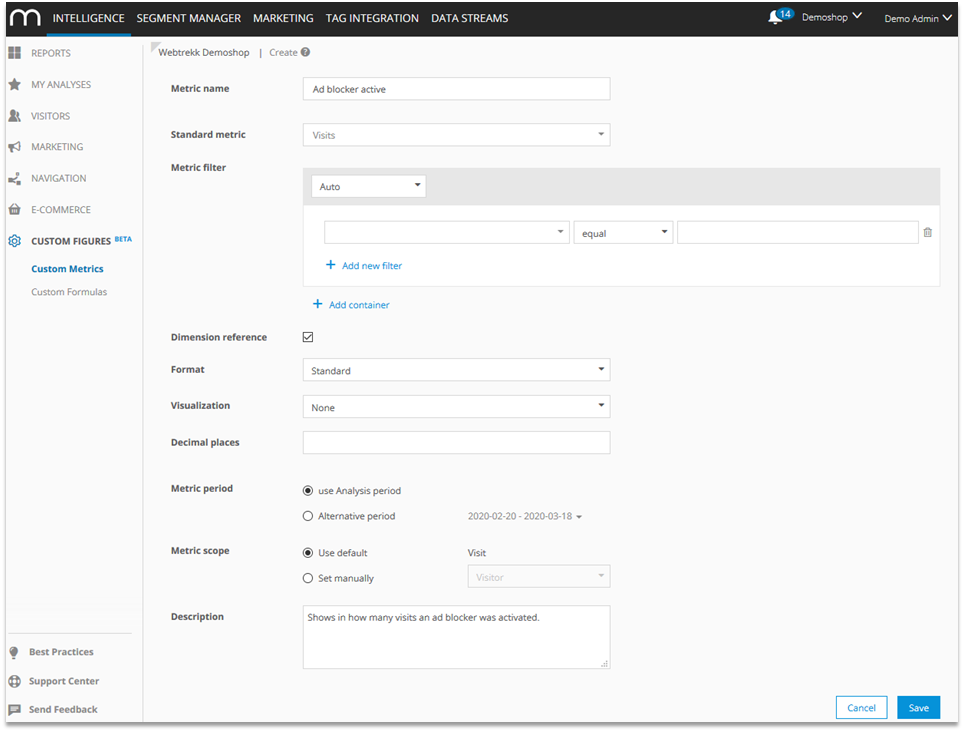
Ad blocker active
This custom metric shows, in how many visits an ad blocker was activated.
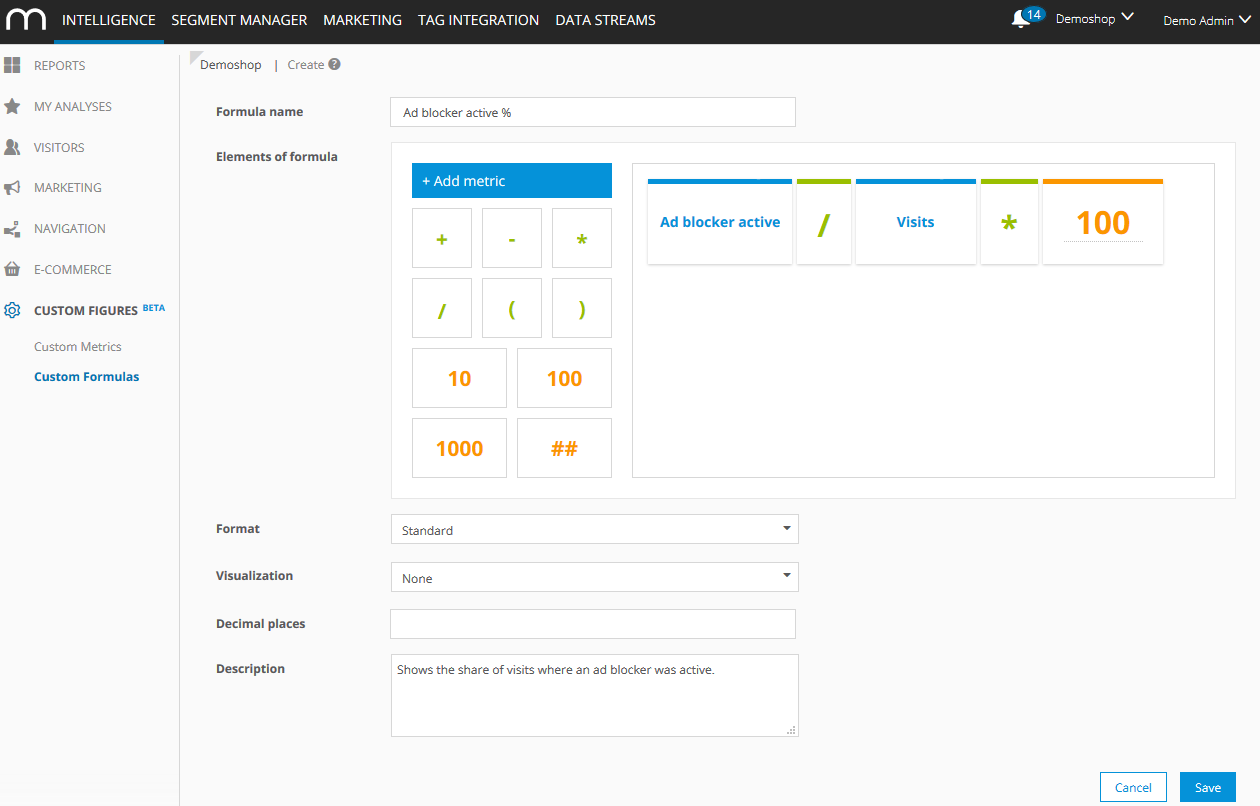
Ad blocker active %
Shows, in what percentage of all visits an ad blocker was activated.
Step 4: Analysis
The following elements are now available for analyses:
Dimension "Adblocker usage": Depicts, if an adblocker was active or not (yes/no).
Metric "Qty Adblocker usage": Depicts, how often the plugin tracked data for the adblocker usage.
Metric "Adblocker active": Depicts, how often an adblocker was active within a visit.
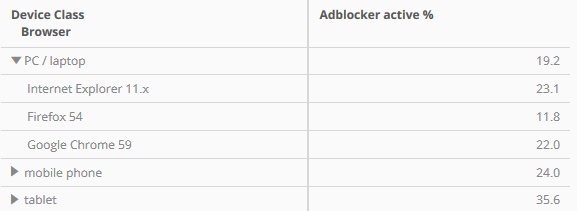
Metric "Adblocker active %": Depicts, in what percentage of all visits an adblocker was active.
How often was an ad blocker used?

How does the ad blocker usage develop over time?

How is the usage of ad blockers spread over device classes and browsers?
How many page accesses were made with activated ad blocker?
For answering this question, we filter the analysis as follows:

