Creating impactful reports in Mapp Intelligence goes beyond just presenting data—it’s about delivering clear, actionable insights that drive decision-making. This guide offers best practices for structuring your reports, setting clear goals, targeting the right audience, and standardizing report templates for consistency. Learn how to avoid information overload, use segmentation effectively, and enhance your reports with meaningful notes and formatting. These tips will help you optimize your reporting process and communicate key findings with clarity and purpose.
Mapp Intelligence allows comprehensive reports to be created.
Deliver effective reports – Information instead of data.
Protect yourself against an information overload and adjust the reporting according to your possibility of taking action upon the information.
If you can only make changes to specific areas every month, then try not to check the figures each day.
1 Goals and success
Targets
What are your targets for the website, and how are you going to measure them? Use targets to define essential KPIs.
E.g., conversion rate, click-out rate
Successful or not?
Define target values to assess your actions objectively! Mapp Intelligence supports an import for this kind of data.
2 Report Structure and Target Groups
Report Structure
Take care of a coherent structure of your reports.
Example: Structuring by user behavior.
Where and who?
Analyses that show the origin/source of the traffic
E.g., campaigns, referrer, device class…What?
Analyses that show the usage of the content
e.g., paths, actions, pages, Qty Product Views…Results?
Analyses of Goal Achievement
e.g., Qty Orders, newsletter registration, other registrations…
Target Groups
To whom is the report addressed? Adapt the visualization, as well as the level of detail of the information and the descriptions.
3 Unification of information
Standardization
Wherever possible, standardize reports on similar subject areas. Standards make it easier to read multiple reports.
Possible guideline questions:
How are weekly reports structured?
Which metrics and formulas are used?
In which order are the metrics and formulas added?
Which time frames are used in the analysis?
How are analysis objects and metrics named?
Which filters are used to narrow down analyses?
4 Report Templates
Create report templates
Reports can be copied within an account or across other accounts.
This way, you could create templates e.g., for
daily/weekly/monthly reports
campaign reports
Custom Metrics and Formulas that don‘t exist in the target account are also taken over.
If filters are used, they can be adapted before copying is started.
We suggest setting read-only permission for report templates. This can be done using report categories.
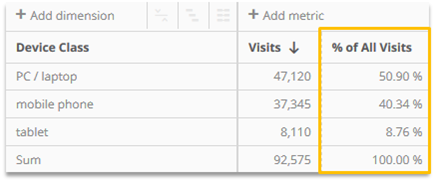
5 Segmentation
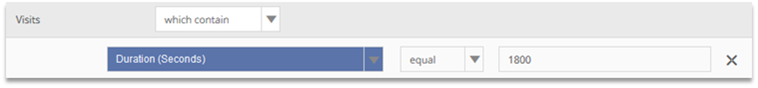
Mapp Intelligence offers various possibilities for segmentation – use them! For instance, do not just look at the average duration but analyze, what happens exactly in a visit with long durations.
6 Simple interpretation
Notes
Only forward new reports and analyses together with explanatory notes. This increases acceptance of the information and helps to avoid misinterpretations.
For general information about the report use the report description. For other notes use a "Dynamic Box".
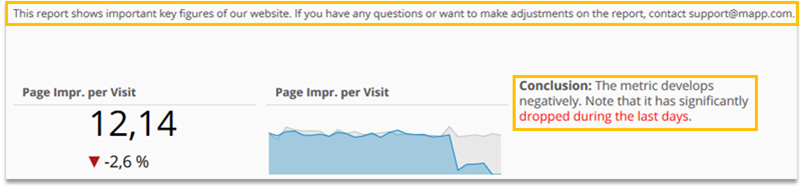
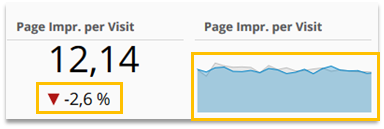
Relative values
"Are 10,000 visits a lot or not?". Enrich your absolute figures with relative values.
In many cases, it will only be the combination of these that allows you to grasp the meaning of the information in question.
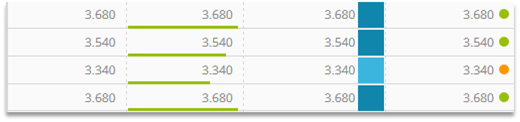
Formatting
Format critical key figures in the data table to improve readability.
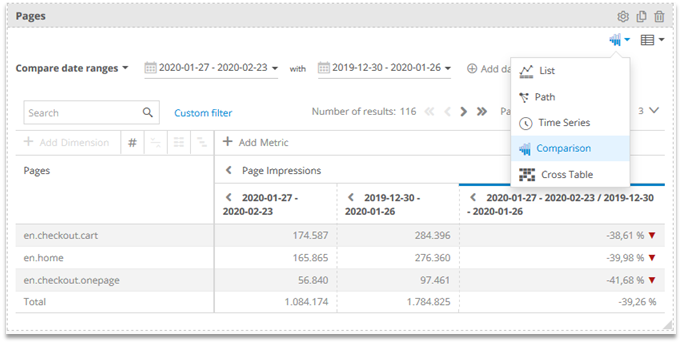
Compare different time intervals
For a time-based comparison use the corresponding option in an analysis, Single KPI and Sparkline.