Besides the basic request list, the Mapp Cloud Debugger provides additional tabs and options for deeper analysis.
This page first explains the available tabs, followed by the options in the top menu.
.png)
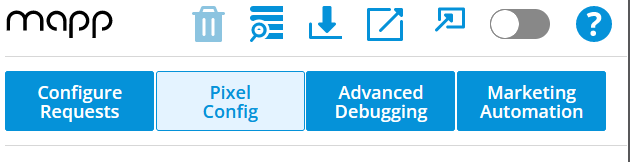
Pixel Config
The Pixel Config tab shows all pixel configurations detected in your open tabs.
Why it’s useful
Verify which configuration file is loaded on each page.
Compare different tabs to spot mismatches.
Detect outdated or incorrect configurations that may affect tracking data quality.
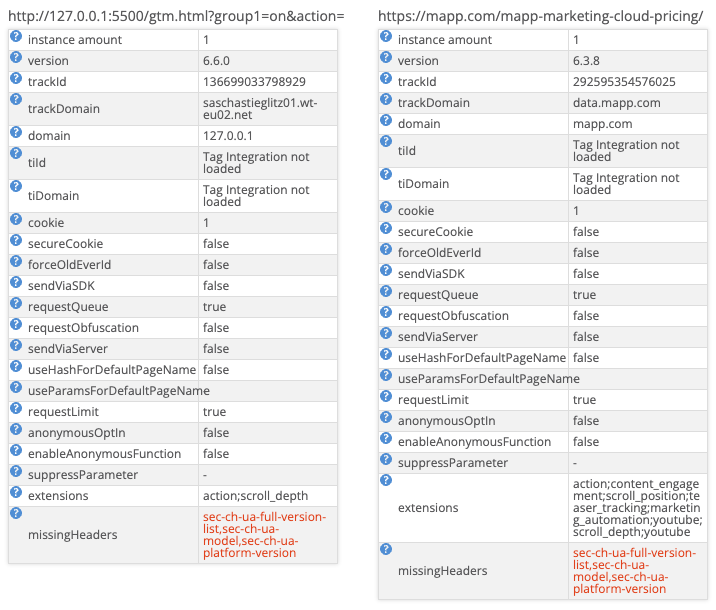
How to check and compare pixel instances from all open browser tabs:
Open the Debugger in tab mode.
Click Pixel Config
You'll get the pixel instances from all tabs opened in your browser, as well as an additional row showing missing headers and a link to generate them.
Advanced Debugging
The Advanced Debugging tab provides extended debugging functionality beyond the standard request list.
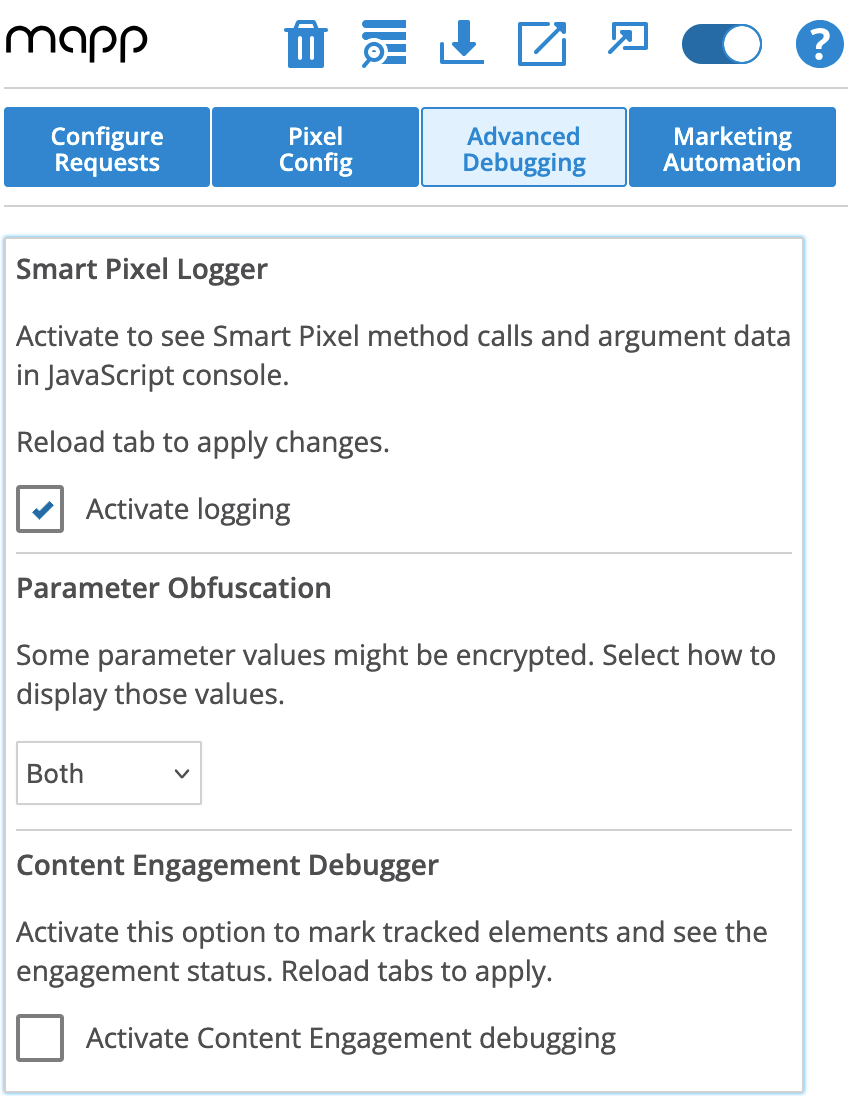
Smart Pixel Logger
Logs all method calls of the Smart Pixel object (wtSmart), showing you exactly when and which data was transmitted to the Pixel.
Each method call is color-coded for better readability, similar to the request list.
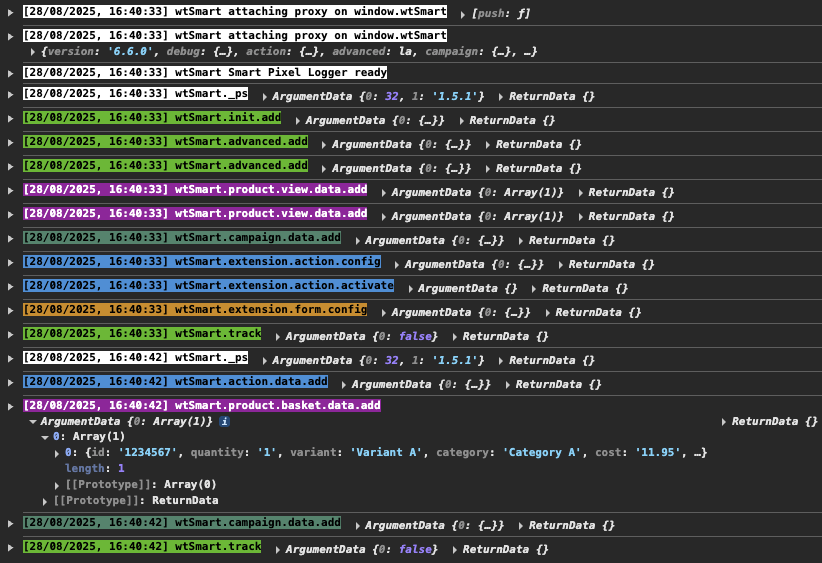
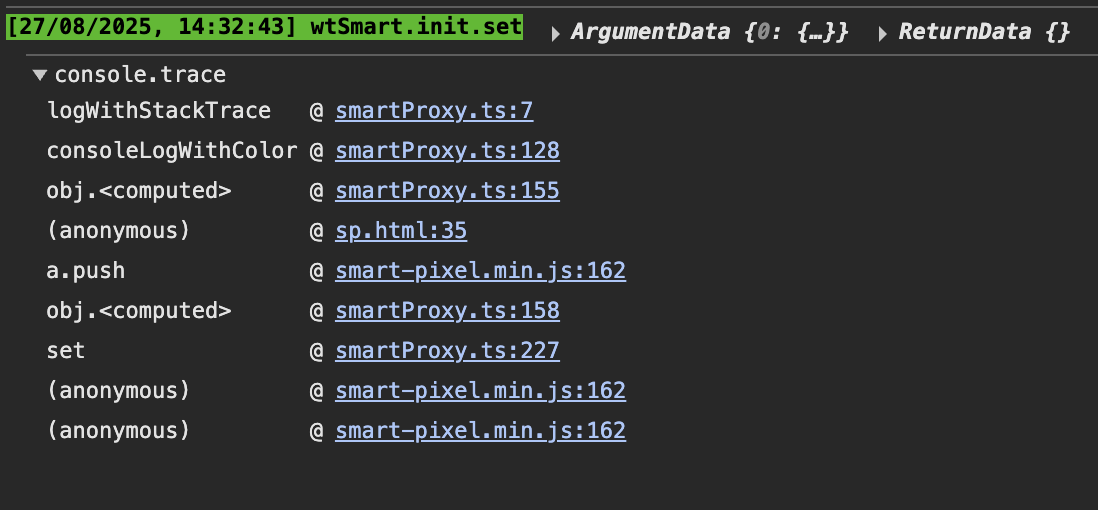
Clicking a log entry shows the full call stack, helping you trace where the call was implemented on your site.
Parameter Obfuscation
Some parameters are encrypted for privacy. Under Parameter Obfuscation, you can choose how to display them:
Encrypted – keep data encrypted
Decrypted – show data in plain text
Both – display both encrypted and decrypted values
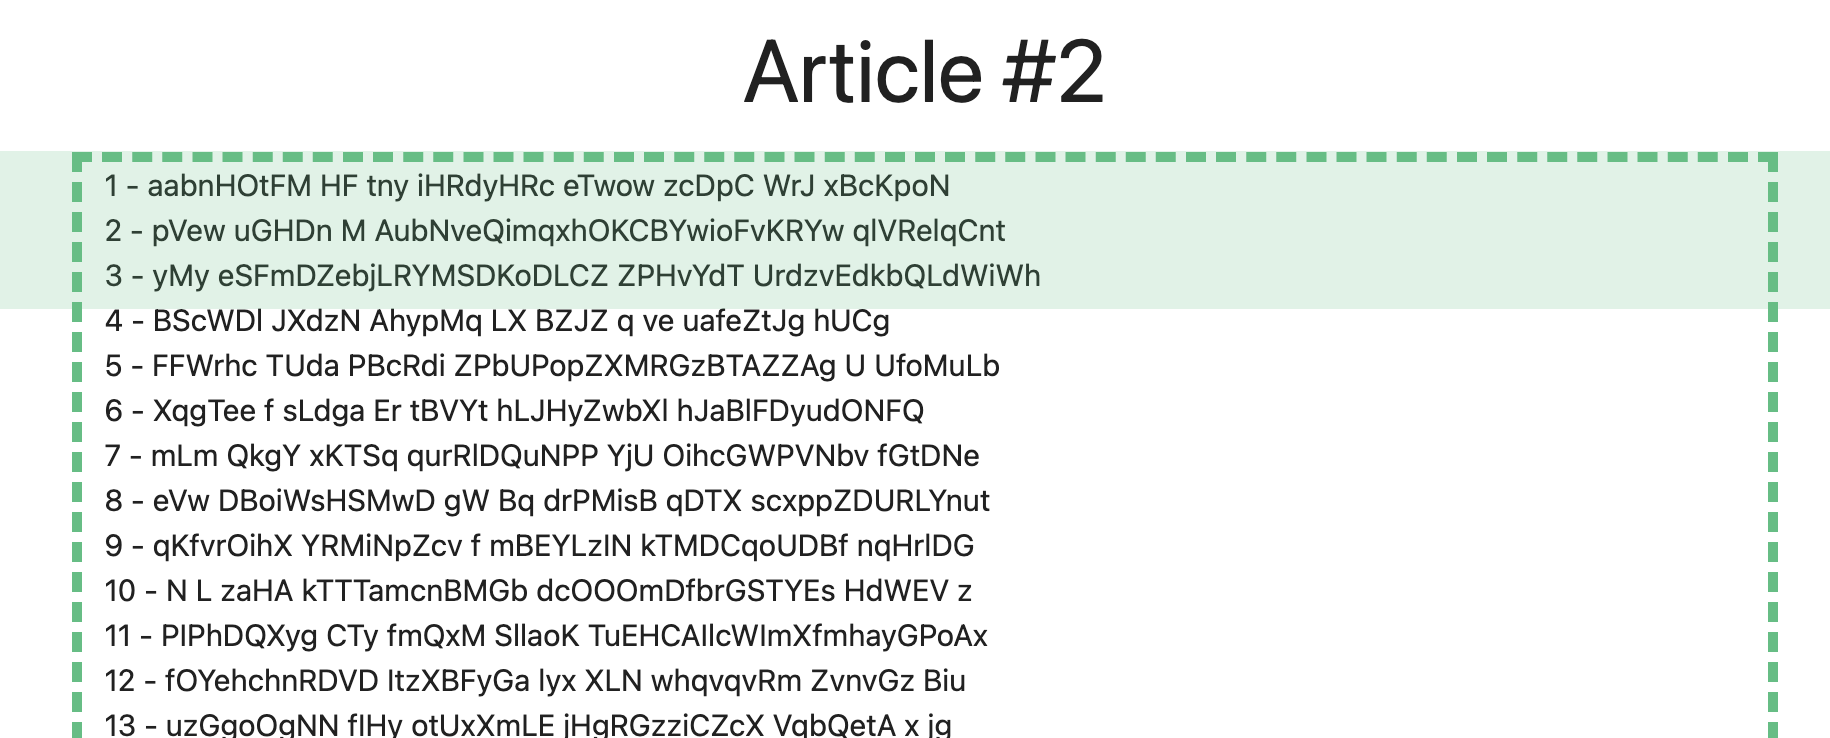
Content Engagement Debugger
Specifically designed to analyze the Mapp Content Engagement plugin.
Helps you verify whether the setup is working correctly and how content blocks are measured.
Adds debug URL parameters to all pages.
Let’s you see directly on the page which content blocks are considered “seen” by the plugin.
After enabling the feature, reload the page to see the markings.
With this setup, you don’t need the developer console to test content engagement.
For detailed information about configuration and usage, see the Content Engagement documentation.
Marketing Automation
In this tab, you can analyze and trigger Marketing Automation campaigns.
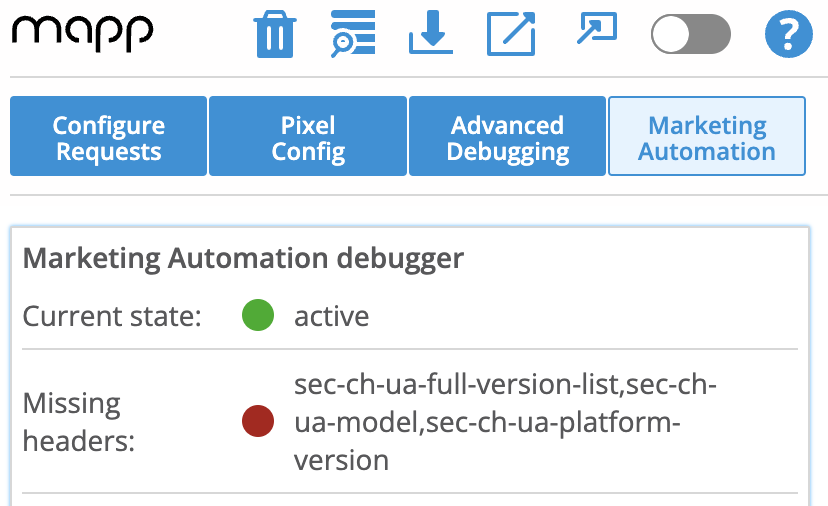
What you can check
Is Mapp Marketing Automation activated?
Are there any missing headers? If yes, which ones?
Which Account (Track-ID) is used?
Which Ever-ID is currently used? (You can change it.)
Are you considered a new user?
Which Marketing Automation campaigns are running?
What you can do
Retrigger campaigns (Layer and Audience Streams only).
Options in the Top Menu
Request Table
The Request Table option provides a full tabular overview of all captured requests.
.png)
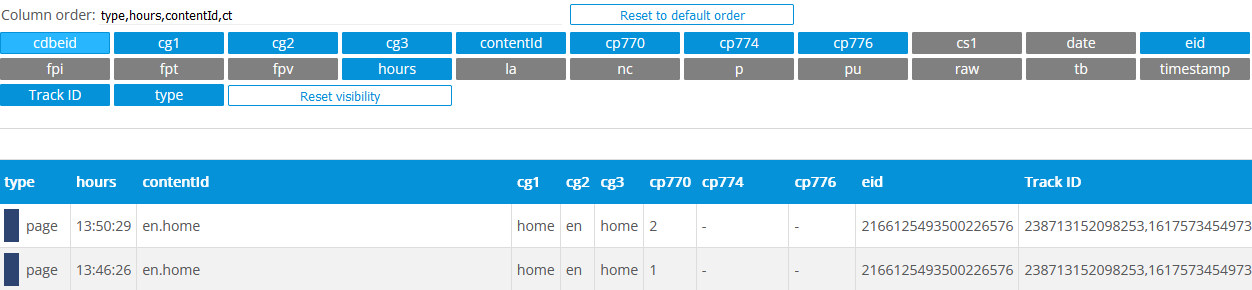
Why it’s useful
Gives you a structured dataset of all requests.
Makes it easy to scan large numbers of requests quickly.
Can be combined with Configure Requests to highlight key parameters across the table.
A maximum of 200 Requests are supported. If you have more requests, the oldest ones get deleted.
Download
The Download option lets you export your captured request data.
.png)
Why it’s useful
Save results for offline analysis.
Share findings with colleagues or attach them to support tickets.
Document test results in a reproducible way.