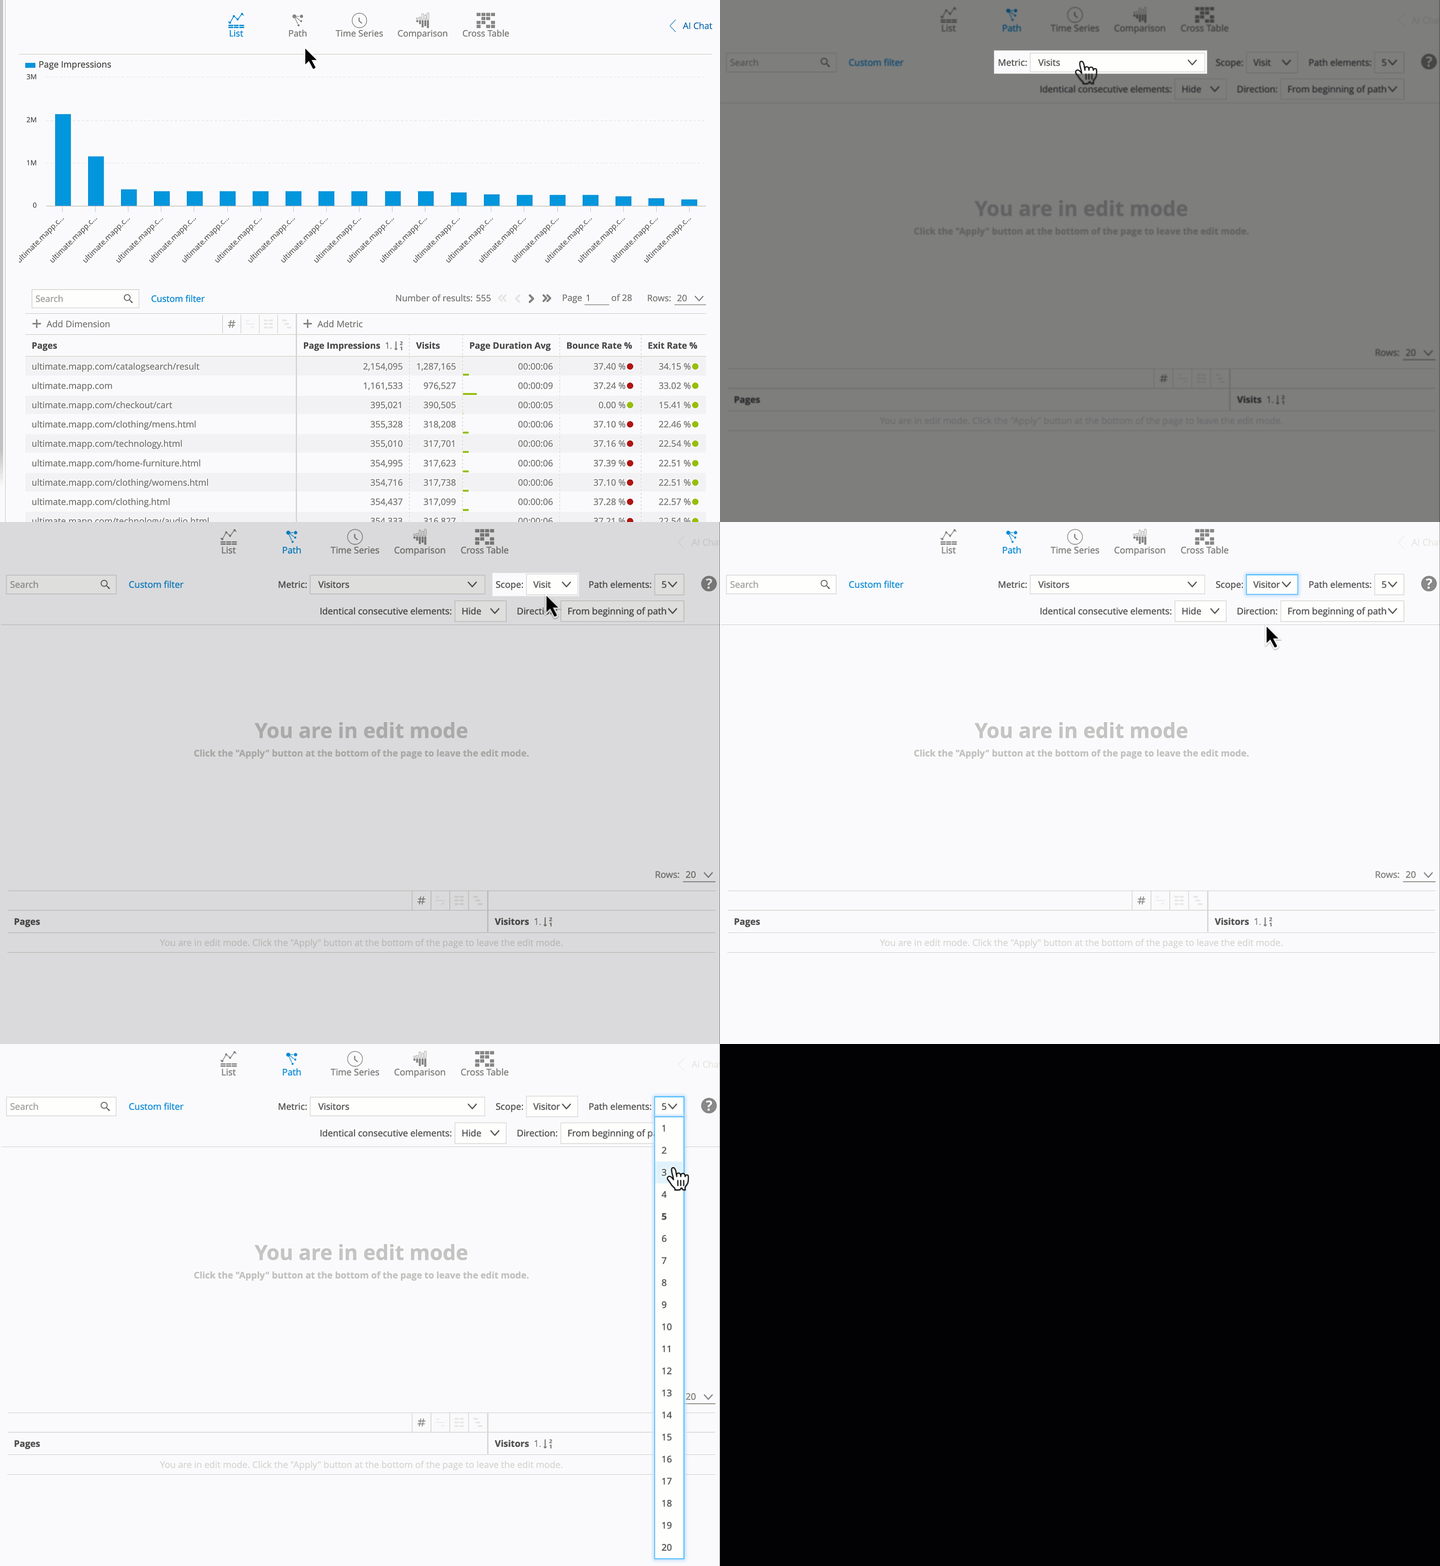
The Path view in Mapp Intelligence is a powerful tool that helps you visualize the order in which users interact with various elements on your website or app. It enables you to analyze sequences, such as page visits or campaign interactions, and gain insights into user behavior patterns.
Key Features:
Visualize Interaction Sequences: Use Path analysis to track user journeys, such as the sequence of pages visited or campaigns clicked.
Scope Options: Define how interactions are grouped:
Page: Focuses on events occurring on a single page, such as clicks or other actions.
Visit: Paths are grouped by individual visits.
Visitor: Paths combine interactions across multiple visits by the same user.
Flexible Metric Selection: While commonly used metrics like Page Impressions, Visits, and Visitors are available, you can also choose from a curated set of additional metrics. This ensures flexibility while maintaining clarity, as not all metrics and formulas are supported in the Path view.
Page Impressions: Counts the total number of page views within the selected scope.
Visits: Counts each unique visit separately.
Visitors: Counts unique users, combining all interactions across multiple sessions.
Configurable Display Options:
Max Elements: Define how many elements to display in the path, with a maximum of 20 elements.
Select the Direction to focus on the first or last N elements.
Hide Consecutive Elements: Simplifies the visualization by merging consecutive repeated elements into one. For example:
If a user navigates: “Home → Home → Products”, with this option enabled, it will display as “Home → Products”.
Optimizing Path Analysis with Filters:
Pro Tip: Apply filters to refine your results.
These filters help focus your analysis on meaningful user journeys and eliminate irrelevant data. For example:
Use Page Impressions > 1 to exclude bounce visits (single-page visits that do not generate paths).
If consecutive repeated pages are hidden, apply Unique Page Impressions > 1 to ensure paths include at least two distinct pages.
Example: Analyzing Pages Paths
Path Configuration:
The video below demonstrates how to configure the Path view to analyze the top three pages in a visitor’s journey during the selected analysis period. The configuration uses the Visitor scope, allowing you to visualize the sequence of pages viewed by a visitor across multiple visits.

Path Analysis:
The video below demonstrates how to interact with the Path visualization, exploring user journeys in detail. It also shows how to apply a filter to focus the analysis on users who viewed more than one page, refining the results for meaningful paths.
Example: Using Scopes and Metrics
In the following examples, we are using the Pages Analysis (Navigation > Pages > Pages) in Mapp Intelligence and activating the Path view. The configurations will demonstrate how different scopes and metrics affect the analysis.
Scenario:
A single user visits your website on two separate occasions:
Visit 1: Home → Products → Contact
Visit 2: Home → Blog
Example 1: Scope = Visit, Metric = Visits
Paths:
“Home → Products → Contact” (1 visit)
“Home → Blog” (1 visit)
Explanation: Each visit is analyzed separately, resulting in two distinct paths.
Configuration used: This example is configured with the scope set to Visit and the metric set to Visits, counting each visit separately.
Example 2: Scope = Visit, Metric = Page Impressions
Paths:
“Home → Products → Contact” (3 Page Impressions)
“Home → Blog” (2 Page Impressions)
Explanation: Paths are still grouped by visits, but the metric counts the total page views within each visit.
Configuration used: This example is configured with the scope set to Visit and the metric set to Page Impressions, counting all page views within each visit.
Example 3: Scope = Visitor, Metric = Visitors
Paths: “Home → Products → Contact → Home → Blog” (1 visitor)
Explanation: Combines all interactions from both visits into a single path for the unique user.
Configuration used: This example is configured with the scope set to Visitor and the metric set to Visitors, combining all visits into a single path and counting it once per unique user.
Summary of Results
Scope | Metric | Path(s) | Count |
|---|---|---|---|
Visit | Visit | 1. “Home → Products → Contact” | 1 Visit |
2. “Home → Blog” | 1 Visit | ||
Visit | Page Impressions | 1. “Home → Products → Contact” | 3 Page Impressions |
2. “Home → Blog” | 2 Page Impressions | ||
Visitor | Visitor | “Home → Products → Contact → Home → Blog” | 1 Visitor |