Before you rely on the data in your reports, you should test whether the Content Engagement plugin is correctly configured and your elements are being tracked.
The plugin offers a built-in debug mode that shows the current configuration and highlights which content elements are active — directly on the page.
How to activate debug mode
To check the plugin setup on your site:
Open the page you want to test in your browser.
Append the parameter ?wt_debug=1 or #wt_debug=1 to the URL.
Reload the page.
Example:
https://yourdomain.com/article.html?wt_debug=1 or
https://yourdomain.com/article.html#wt_debug=1 What you’ll see in debug mode
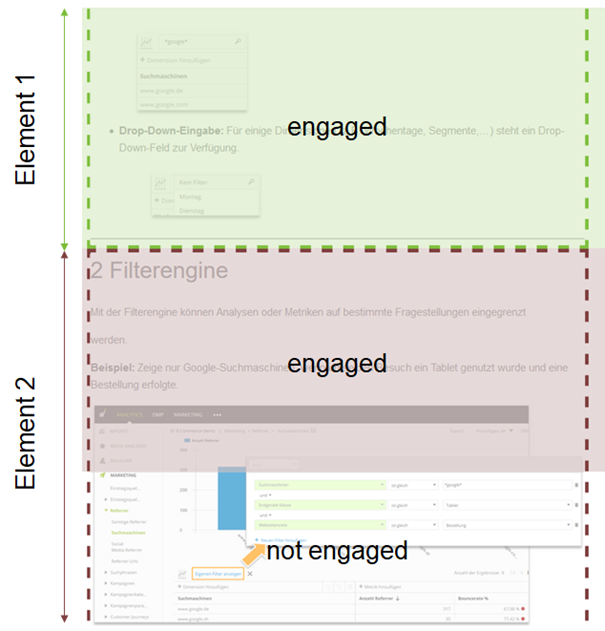
Once activated, the plugin overlays a visual debug view in the browser:
Each tracked element is outlined so you can see which parts of the page are being monitored.
Inside each element, you’ll see color-coded blocks that indicate which portions have been measured as engaged — based on the current scroll position, visibility, and configured thresholds.
Additional info such as the element name and engagement percentage is also displayed.
This allows you to verify:
Which elements were correctly detected.
How engagement is applied in real time.
Whether the plugin uses your custom configuration as expected.