Once the plugin is active and your custom formulas are created, you can analyze the performance of your content elements in Mapp Intelligence.
There are two typical ways to explore this data – depending on what you want to learn.
Use Case 1: Performance of individual content elements
This use case helps you evaluate how well different parts of your content performed. For example, in a long training article, each section is tracked separately so you can compare them.
Navigation path: Navigation > Event Parameters > Content Engagement – Name
Analyzed parameter: Content Engagement – Name
Metrics:
Page Impressions
Content Engagement > 50 %
Screenshot reference:
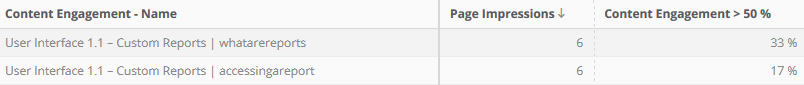
The screenshot shows two content sections:
User Interface 1.1 – Custom Reports | whatarereports
User Interface 1.1 – Custom Reports | accessingareport
Use Case 2: Visibility levels for each content element
This analysis shows how often each content element was displayed, broken down by visibility levels (0 %, 25 %, 50 %, 75 %). By structuring the table as a pivot view, you get a funnel-like overview of how deeply users engaged with each section of content.
Navigation path: Navigation > Event Parameters > Content Engagement – Name → Add Dimension: Content Engagement – Element Visibility (Text)
Analyzed parameters:
Content Engagement – Name
Content Engagement – Element Visibility (Text)
Metric: Qty Content Engagement – Name
Screenshot reference:
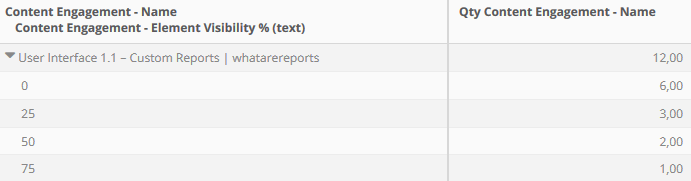
In the example, the element User Interface 1.1 – Custom Reports | whatarereports is expanded to show how frequently it was visible at each depth level.
This helps you assess where users dropped off and how thoroughly each section was viewed – even when multiple elements are placed on a single page.