In Mapp Intelligence, filtering is a powerful tool that sets us apart from other analytics solutions. Thanks to the use of raw data, you can apply filters to nearly any element tracked in the system, unlocking limitless possibilities to refine your analysis. This flexibility allows you to focus on the data that matters most, making it easier to uncover meaningful insights.
1. Quick Search: The Fast Way to Narrow Down Your View
The Quick Search is a simple yet effective way to filter the results of your analysis.
Purpose: It helps you quickly filter results without having to set up a complex filter. For example, if your analysis includes 1,000 pages, but you’re only interested in your blog content, you can instantly narrow it down using Quick Search.
How to Use It:
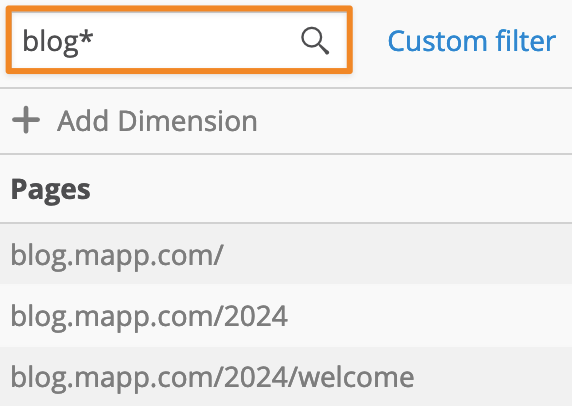
Free Text Field: Type a keyword (e.g., “blog”) into the search box to display only relevant pages containing that term.
Placeholders: Use the asterisk (*) as a wildcard to include variations. For instance, typing “blog*” would capture all pages that start with “blog” (e.g., “blog-post,” “blog-2024”).
Drop-down Options: For dimensions like Weekdays or Segments, select from a drop-down menu to filter the data.
Quick Search is perfect for quick, on-the-spot filtering, allowing you to focus on specific data points without overcomplicating your analysis.
2. Filter Engine: Advanced Filtering for Deeper Insights
For more advanced filtering, the Filter Engine is where the true power lies. This tool allows you to create complex filters using the Custom Filter button.
Purpose: While Quick Search is ideal for simple filtering, the Filter Engine gives you the flexibility to combine multiple conditions, enabling highly specific filters.
How to Use It:
Click the Custom Filter button to access the Filter Engine.
You can filter your analysis based on any tracked element. For example, if you’re analyzing pages, you might only want to include those viewed by users who made a purchase within the same session.
Scoping Filters: The Filter Engine also supports different scopes, allowing you to limit your filters to specific levels, such as a single visit, an entire visitor’s history, or just individual pages. This flexibility enables you to tailor your analysis to focus precisely on the data you need.
Metric Filtering: You can also filter individual metrics using the Filter Engine. For instance, you could filter metrics like conversion rate to focus on users who came through specific campaigns.To filter a specific metric, you can access additional filtering options via the context menu. For a detailed walkthrough on configuring metric filters, refer to our training chapter on Custom Figures.
Example: Imagine you want to identify which blog posts drive users to explore further. Using the Filter Engine, you can set a filter to show users who visited a specific blog post and then continued to view at least three additional pages in the same session. This helps content marketers understand which posts are effectively engaging users and encouraging them to explore more content on your site.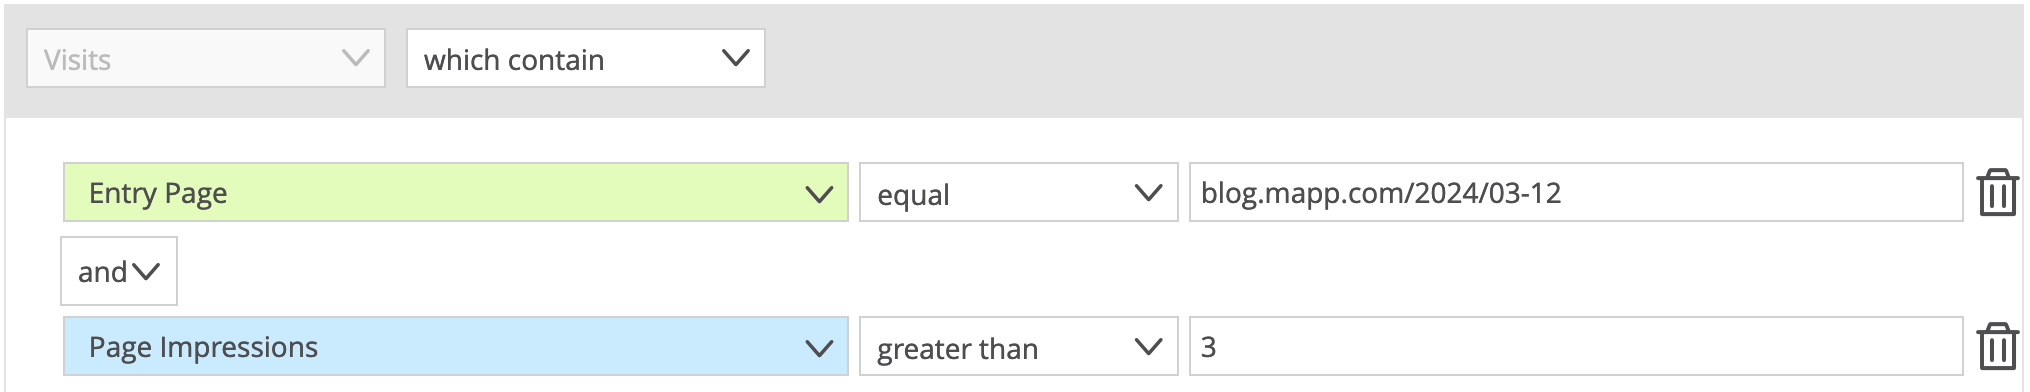
The flexibility of the Filter Engine allows you to tailor your analysis to fit your specific needs, helping you uncover deeper insights that are not possible with standard filtering tools.
For more practical examples of how to leverage the Filter Engine, explore our section on Specific Use Cases, where you’ll find detailed scenarios tailored to common analysis challenges.
For additional details on the concepts and configurations, check our training chapter on Segmentation and Filter Options.
3. Drill-Down Function: Exploring Data Step-by-Step
The Drill-Down feature is perfect for when you spot something interesting in your analysis and want to explore it further. It allows you to apply a selected element as a filter in a new analysis, making it easier to dive deeper into your data.
How It Works:
Highlight the data element you’re interested in (e.g., a specific blog post that’s performing well).
Right-click and select a follow-up analysis (like Device Class Analysis) from the context menu.
The selected item will automatically be used as a filter in the new analysis, allowing you to dive deeper into the factors contributing to its performance.
You can continue adding filters in subsequent analyses to refine your focus even further.
Example: Imagine you notice that a blog post titled “Top Marketing Trends” is driving unusually high traffic. By using the Drill-Down function, you can quickly move to a Device Class Analysis to see which devices (e.g., tablets, desktops, or smartphones) users were using when they engaged with this content. This helps you understand how device preferences might influence content engagement and optimize your strategies accordingly..