The following use cases illustrate how user-centric data in Mapp Intelligence can support targeted analytics, segmentation, and engagement strategies:
A) Identifying High-Engagement Users Based on Visit Gaps
By filtering for users with gaps longer than a specified period, analysts can identify those who visit the website infrequently or have a high lapse time between visits. This insight is particularly useful for re-engagement campaigns, allowing marketers to target users who have not visited in a while, with tailored content to bring them back.
Analysis: Individual Analysis
.png)
Reading Example
Metric | Description |
|---|---|
Visits | For 69,717 visits, the last access occurred 1 day prior. |
B) Calculating Days Between Visits
Understanding the days between user visits and orders helps reveal engagement patterns and the frequency of repeat purchases. This analysis can support personalized retargeting strategies, loyalty campaigns, or timing-based marketing, such as sending reminders to users after a specific lapse period.
Analysis: Individual Analysis
.png)
Reading Example
Metric | Description |
|---|---|
Visitors | 271 users made their second visit one day after their first visit. |
C) Calculating Days Between Orders
This use case examines the time elapsed between consecutive orders, providing insights into purchasing frequency and helping to design campaigns to encourage repeat purchases within certain intervals.
Analysis: Individual Analysis
.png)
Reading Example
Metric | Description |
|---|---|
Qty Orders | For 6,131 orders, the last order was placed 2 days prior. |
D) Analyzing Days Between Orders for Users with Multiple Purchases
This use case helps identify purchasing patterns among users who have placed at least two orders. By calculating the interval between these orders, analysts can gain insights into the frequency of repeat purchases, which is valuable for loyalty and retention strategies.
Analysis: Individual Analysis
.png)
Reading Example
Metric | Description |
|---|---|
Visitors | 6710 visitors made their second order on the same day as their first order. |
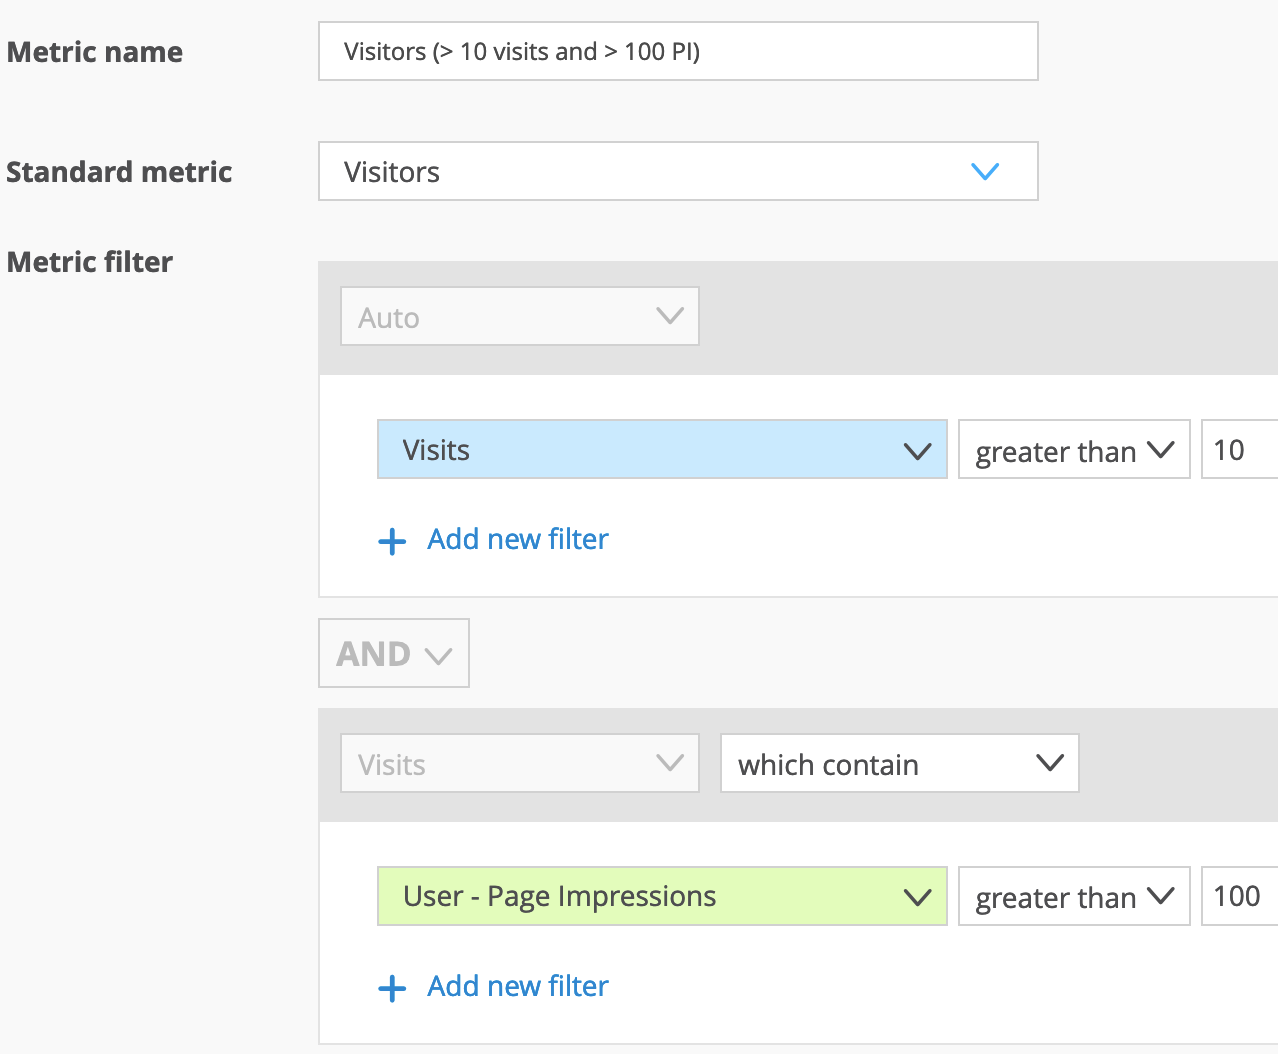
E) High-Engagement Users by Visit Frequency and Page Impressions
This use case allows analysts to filter for users who have shown high engagement by visiting more than 10 times during the analysis period and generating over 100 page impressions in their lifetime. This segmentation is useful for understanding and targeting highly engaged users who frequently interact with content.
Analysis: Individual Analysis
.png)
Reading Example
Metric | Description |
|---|---|
Visitors | A total of 79,651 visitors accessed the website in March. |
Visitors (> 10 visits and > 100 PI)* | In October, 3,228 visitors had more than 10 visits during the analysis period and accumulated over 100 page impressions in their lifetime to date. |
*This is a custom metric
Used filters for the custom metric:
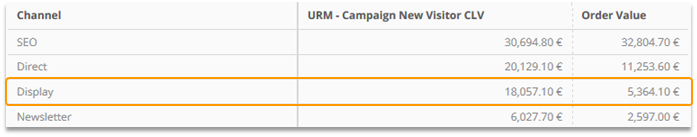
F) Measuring Revenue from New Visitors via Campaign Channels
This use case evaluates the revenue generated by new visitors attributed to specific campaign channels, allowing for two distinct approaches based on the metrics selected:
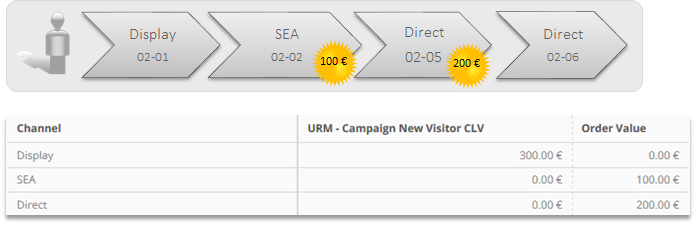
Using Customer Lifetime Value (CLV): The Customer Lifetime Value metric assigns all revenue generated by a user throughout their lifetime to the original acquisition channel. This provides a comprehensive view of the total revenue impact per channel for newly acquired users.
Using Other E-commerce Metrics (e.g., Order Value): When using metrics like Order Value, revenue attribution depends on the selected attribution model. This approach allows for flexibility in assigning revenue to different touchpoints based on the chosen model, rather than solely attributing it to the acquisition channel.
Analysis: Marketing > Campaign Categories > [Name of the campaign channel]
.png)
Reading Example
Metric | Description |
|---|---|
User – Campaign New Visitor CLV | A total of 712,753.78 € in order value was generated by new visitors tracked via the ‘Display’ channel. |
Order Value | A total of 3,701,245.09 € in order value was attributed to the ‘Display’ channel based on the default attribution model. |