Multiple assignment models allow you to distribute attribution credit across several campaigns or channels, providing a comprehensive view of the customer journey. This approach helps you evaluate the combined impact of multiple marketing touchpoints instead of assigning the full conversion value to a single interaction.
Why Use Multiple Assignment Models?
Multiple assignment models are useful when:
Customer journeys involve several campaigns or channels before conversion.
You want to avoid overvaluing a single touchpoint (for example, last click).
Credit should be shared more fairly across contributing marketing activities.
1 Overview of Multiple Assignment Models
We differentiate between manual models, where the user configures weightings or distribution rules, and the automatic model, which dynamically calculates channel contributions using data-driven insights.
The table below summarizes the key characteristics of the multiple assignment models, helping you decide which one best fits your needs:
Model | Type | Description | Best For |
|---|---|---|---|
Data-Driven Attribution (DDA) | Automatic | Attribution credit is calculated dynamically using Shapley Values and historical customer journey data. | Complex journeys with many touchpoints |
Distribution Across All Ad Media | Manual | Credit is distributed across all campaigns with manually configured weightings. | Simple use cases requiring precise control |
Distribution Across the Last Five Ad Media | Manual | Credit is distributed among the last five campaigns using user-defined percentages. | Scenarios where recent interactions matter most. |
2 Data-Driven Attribution (DDA)
Data-Driven Attribution (DDA) distributes conversion value across marketing channels based on their observed contribution in real customer journeys. The model is based on Simplified Shapley Values, a transparent, data-driven approach derived from game theory.
DDA operates at channel level (not individual campaign level) and is designed to support strategic budget allocation rather than granular media optimization.
2.1 Why Use DDA?
DDA helps marketers by:
Distributing credit fairly across all contributing channels.
Reflecting actual customer behavior instead of fixed attribution rules.
Adapting automatically as customer journeys change over time.
2.2 How DDA works
DDA follows two main steps:
Shapley Values Calculation
Historical customer journeys are analyzed to determine each channel’s contribution to conversions.
Attribution to New Journeys
The calculated Shapley Values are applied to new journeys to distribute conversion value.
Step 1: Shapley Value Calculation (Simplified Example)
Shapley Values measure the marginal contribution of each channel across all observed journeys.
In simplified terms:
Each channel participating in a journey contributes to the total conversion value.
Contributions are aggregated across all journeys.
Each channel’s share of the total conversion value becomes its Shapley Value.
Example (simplified, without positioning)
Customer Journeys | Conversion Value (€) | Contribution SEA (€) | Contribution Email (€) | Contribution Display (€) |
|---|---|---|---|---|
SEA > Display > Email | 300 | 100 | 100 | 100 |
Email > Display | 100 | 0 | 50 | 50 |
Email > SEA | 600 | 300 | 300 | 0 |
Totals | 1000 | 400 | 450 | 150 |
The Shapley Values are then calculated by dividing each channel's total contribution by the overall conversion value (1000 €):
SEA: 400 / 1000 = 40%
Email: 450 / 1000 = 45%
Display: 150 / 1000 = 15%
Channel | Simplified Shapley Value (%) |
SEA | 40% |
45% | |
Display | 15% |
Note
This example illustrates the Shapley principle in a simplified form. Position-specific effects are omitted for clarity. In the actual DDA model, channel contributions are calculated based on their ordered position within the customer journey.
Position in the Customer Journey
In Mapp Intelligence, DDA explicitly considers the position of each channel within the customer journey.
Customer journeys are evaluated as ordered sequences of channels.
Contributions are calculated per channel occurrence and position (for example: first, middle, penultimate, last).
A channel can appear multiple times within a journey and may receive different attribution values depending on its position.
Position is not handled through fixed weightings (such as first-touch or last-touch rules). Instead, position-sensitive effects are reflected through the Shapley calculation based on observed journey patterns.
Step 2: Attribution to New Customer Journeys
Once Shapley Values are available, they are applied to new customer journeys:
Only the channels present in the journey are considered.
Shapley Values are normalized so that the total attribution equals 100%.
Conversion value is distributed according to the normalized contributions.
Example:
Customer Journey | Conversion Value (€) | SEA (%) | Email (%) | Display (%) |
Display > Email | 200 | 0% | 75% (normalized: 45/(45+15)) | 25% (normalized: 15/(45+15)) |
SEA > Display > Email | 300 | 40% | 45% | 15% |
Attributed Values:
Customer Journey | SEA (€) | Email (€) | Display (€) |
Display > Email | 0 | 150 | 50 |
SEA > Display > Email | 120 | 135 | 45 |
The percentages in the table above are normalized for the relevant channels in each customer journey to ensure the total equals 100%. For example, in the Display > Email journey, Email's contribution of 45% and Display's 15% are recalculated as 75% and 25%, respectively.
This step-by-step approach ensures that credit is distributed fairly to each channel based on its role and position in the customer journey.
2.3 Additional Information for Marketers
Clear Visibility:
Use the attribution metrics for analysis and the Smart notification to understand the calculated shared each channel has.Dynamic Updates:
Shapley Values are recalculated daily using the most recent data.
Early Phase Behavior:
If insufficient data is available, attribution is distributed equally across channels.
Transparency:
The model provides consistent and explainable attribution results based on real customer journeys.
3 Distribution across all Ad Media
This manual model assigns attribution credit to all campaigns recorded in the customer journey.
Weightings are configured manually.
Position-based percentages can be defined.
If fewer campaigns are present than configured positions, weightings are normalized automatically.
This model is suitable when you want full control over how attribution credit is distributed.
Example: Configuration including percentage-based distribution per position for metric Order Value

Customer Journey
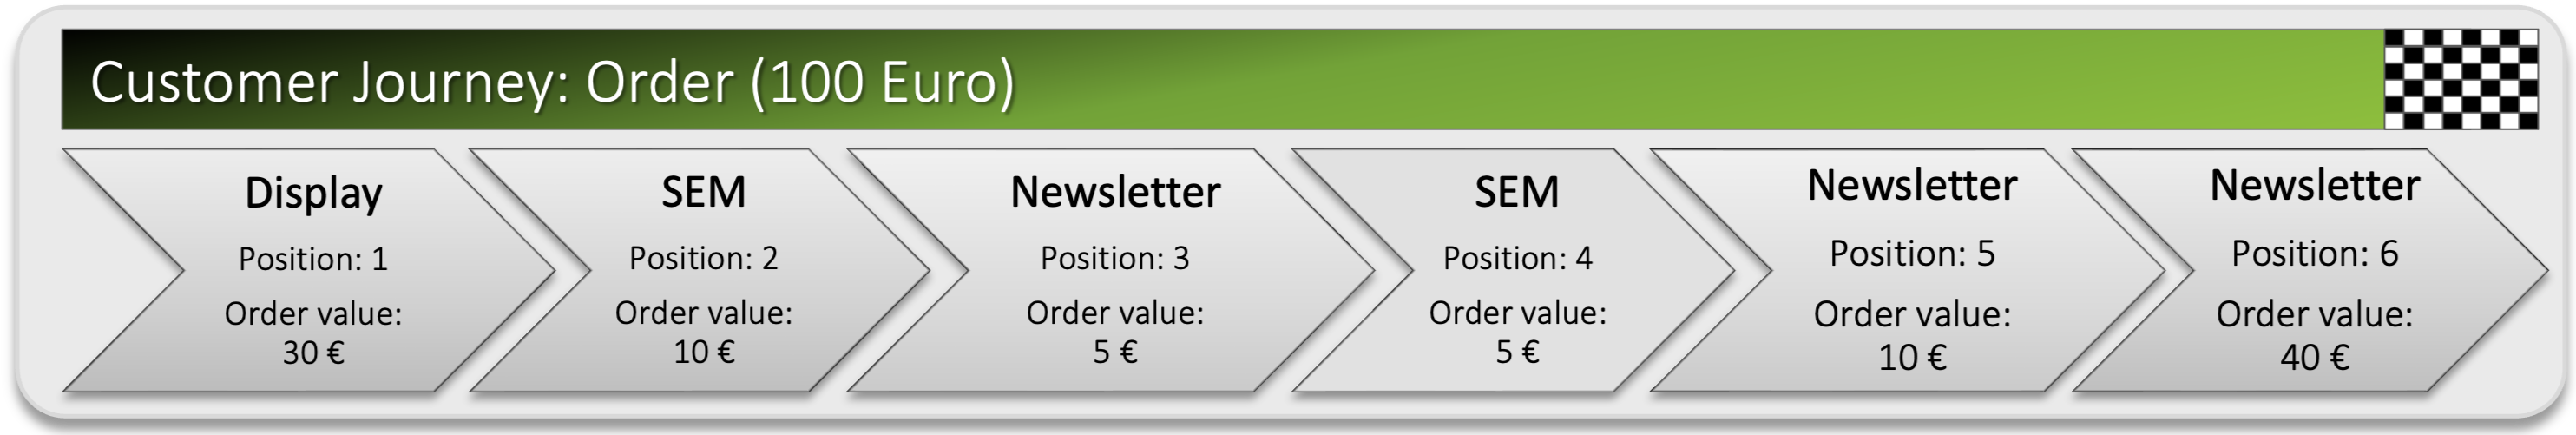
Analysis
.png)
If less than 5 Ad media are available, the weightings will be distributed.
Example: Overview of normalized weightings with varying numbers of campaign contacts
.png)
Number of campaign contacts in the Customer Journey | ||||||
|---|---|---|---|---|---|---|
1 | 2 | 3 | 4 | 5 | 6 | |
Endmost | 100% | 55% | 50% last + next to last | 42.5% last + (0.25* other) | 40% | 40% |
Second to last | 45% first + second + | 10% other | 12.5% next to last + (0.25*other) | 10% | 10% | |
Third to last | 40% first + second | 12.5% second + (0.25*other) | 10% | 5% 0.5*other | ||
Fourth to last | 32.5% first + (0.25*other) | 10% | 5% 0.5*other | |||
Fifth to last | 30% | 10% | ||||
Sixth to last | 30% | |||||
Traffic source Weighting
In addition to the position within the Customer Journey, the campaign type can also be used for analysis purposes with traffic source weightings.
Example: Overview of normalized weightings with varying numbers of campaign contacts
.png)
Position | Campaign | Position weighting | Traffic source weighting | Overall weighting | Normalization factor | Final normalization |
|---|---|---|---|---|---|---|
Endmost | SEM | 40% | 100% | 40% | 100 / 80 | 50% |
Second to last | SEM | 10% | 100% | 10% | 100 / 80 | 12.5% |
Third to last | Newsletter | 10% | 30% | 3% | 100 / 80 | 3.75% |
Fourth to last | Newsletter | 10% | 30% | 3% | 100 / 80 | 3.75% |
Fifth to last | Banner | 30% | 80% | 24% | 100 / 80 | 30% |
100% | 80% | 100% |
4 Distribution across the last five Ad Media
This model focuses on the five most recent campaigns before conversion.
Attribution is based on user-defined position weightings.
If fewer than five campaigns are present, values are normalized.
Campaigns beyond the fifth position receive no credit.
This approach is useful when recent interactions are considered more influential than earlier touchpoints.
Example: Configuration including percentage-based distribution per position for metric Order Value

Customer Journey
.png)
Analysis
.png)
If less than five Ad media are available, the data will be normalized.
Example: Normalizing three Ad Media
.png)
Position weighting | Normalization factor | Normalized weighting | |
|---|---|---|---|
Endmost | 50% | 100 / 85 = 1.17647 | 1.17647 * 50% = 58.82% |
Second to last | 20% | 100 / 85 = 1.17647 | 1.17647 * 20% = 23.53% |
Third to last | 15% | 100 / 85 = 1.17647 | 1.17647 * 15% = 17.65% |
Fourth to last | - | ||
Fifth to last | - | ||
Total | 85% | 100% |
Example: Overview of normalized weightings with varying numbers of campaign contacts
.png)
Number of campaign contacts in the Customer Journey | ||||||
|---|---|---|---|---|---|---|
1 | 2 | 3 | 4 | 5 | 6 | |
Endmost | 100% | 71.43% | 58.82% | 52.63% | 50% | 50% |
Second to last | 28.57% | 23.53% | 21.05% | 20% | 20% | |
Third to last | 17.65% | 15.79% | 15% | 15% | ||
Fourth to last | 10.53% | 10% | 10% | |||
Fifth to last | 5% | 5% | ||||
Sixth to last | 0% | |||||