Creating and editing reports in Mapp Intelligence allows you to tailor data presentations to your needs. This guide walks you through the process of setting up new reports, customizing report elements, and configuring options to enhance your analyses. Learn how to add various components like analyses, KPIs, sparklines, and dynamic boxes, and discover how to effectively use filters to refine your data. Whether you’re building reports from scratch or modifying existing ones, this article provides the essential steps to maximize the impact of your reporting.
Visit
Find more information in the course Mapp Intelligence - Reports.
.png "Mapp Academy")
1 Setting up a report
There are two ways to create a new report:
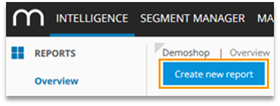
Via Reports > Overview > Create new report.
Via adding an existing analysis to a report.
To do so, select the dialogue Add to > Report within an analysis.
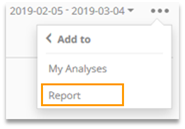
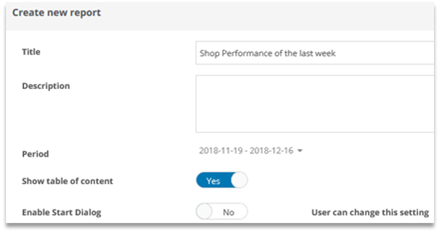
A new window will open; choose "new report" here.Afterward, the report's basic properties can be configured. The section on report options provides further information.
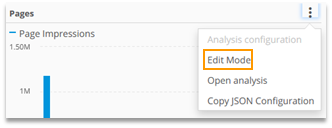
2 Editing reports
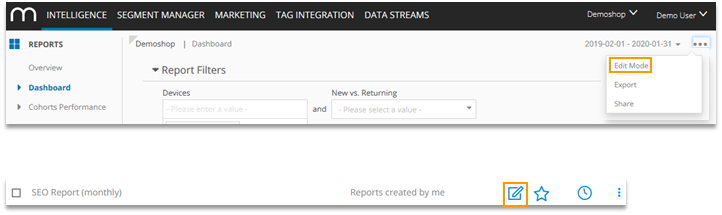
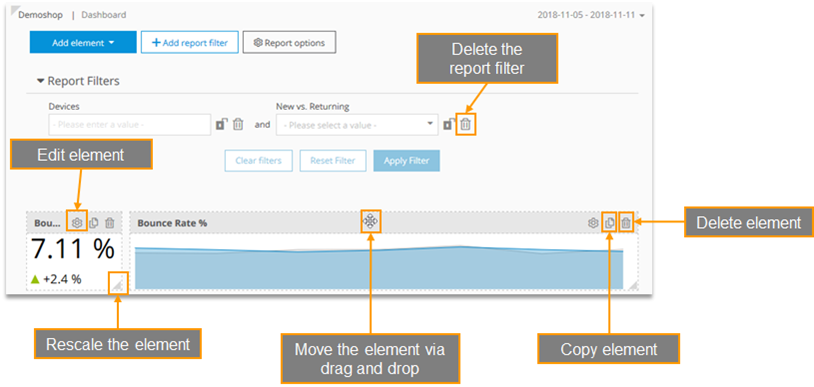
In the Edit Mode, all elements can be configured, arranged and new elements can be added.
The following adaptions can be made:
Add and edit elements and report filters
Changing the report options (e.g., dispatch via email, sharing reports, time period)
In the edit mode, the data values that are shown are sampled to increase the calculation speed. |
|---|
3 Adding Elements
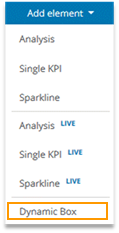
In Edit mode, further elements can be added to reports.
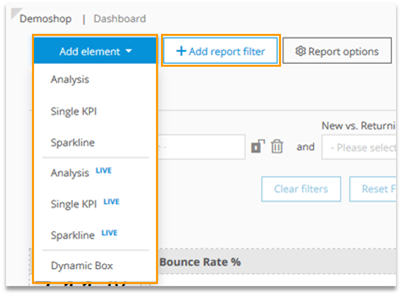
The following elements are available:
Analysis / Analysis Live
Single KPI / Single KPI Live
Sparkline / Sparkline Live
Dynamic Box
Report filters
Information on Live Elements (which are optionally available) can be found in the training chapter on Live Elements in Reports. |
|---|
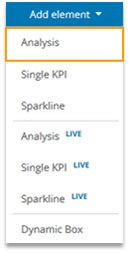
3.1 Analysis
In the window "Add analysis" an analysis can be chosen.
The default setup is loaded, which then can be customized.
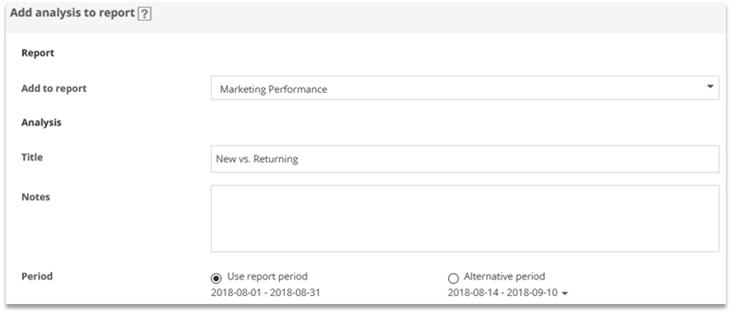
Alternatively, within an analysis (outside of a report), you can choose Add to > Report.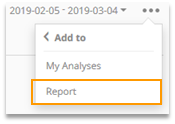
Afterward, choose the report to which the analysis should be added or choose to
create a new one.Moreover, you can change the setting for the analysis to be taken over.
Each analysis can be opened separately via „Open analysis“.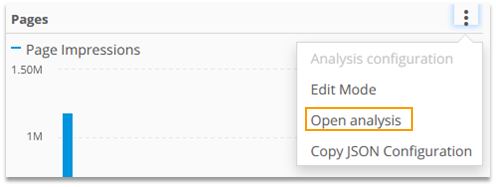
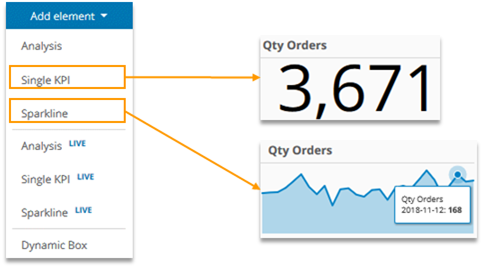
3.2 Single KPI and Sparkline
Metrics and Formulas can be shown in a report as "Single KPI" or "Sparkline".
"Single KPI" shows the total number, and "Sparkline" shows the development daily.
In general, a time comparison should be activated for each metric or formula.
Only by doing so a quick evaluation is possible.
The options allow to adapt the configuration.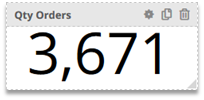
Adaptions made here only have an effect on this specific Single KPI or Sparkline.
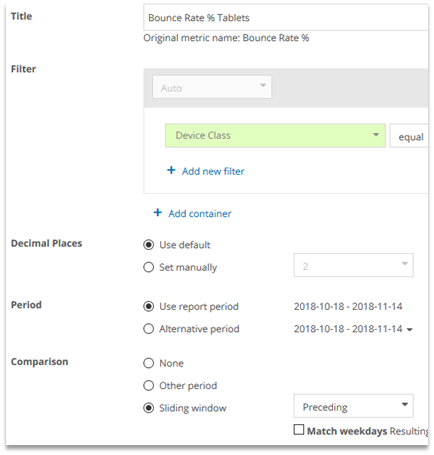
The following adaptions can be made:
Changing the title
Filtering
Decimal Places shown
Alternative time period (shown in the element)
Activating the comparison
In general, a time comparison should be activated for each metric or formula.
Only by doing so a quick evaluation is possible.
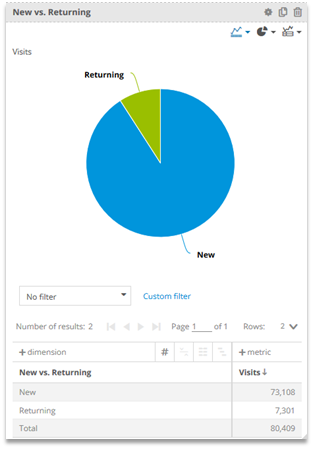
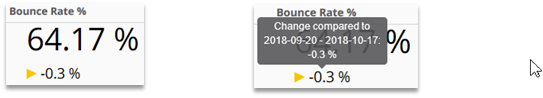
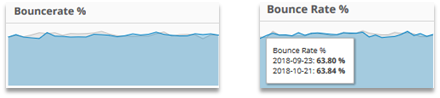
Single KPI
The comparison is shown below the value of the formular or metric.
The comparison time period is visible on mouse over.
Sparkline
The comparison period is shown in grey.
Details are visible on mouseover.
When editing a Single KPI or Sparkline, you can either choose "Other period" or "Sliding window".
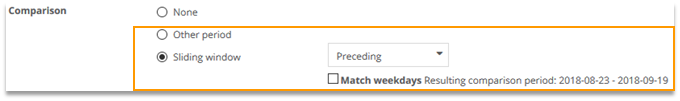
Other period
Use the calendar to choose the comparison period.Sliding window
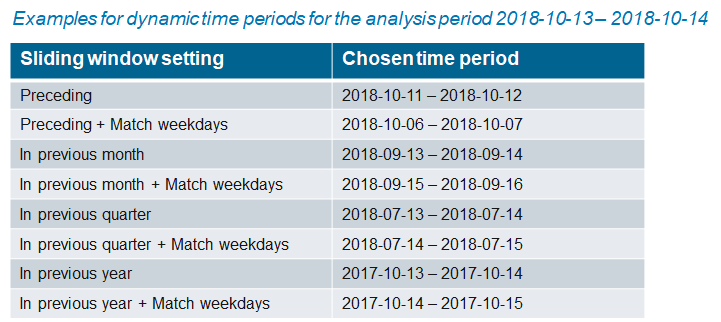
The comparison period is chosen automatically. Here you also can choose whether the comparison period should include the same amount of each weekday.Preceding: the period directly before the analysis period
In previous year: the same period one year ago
In previous quarter: the same period one quarter ago
In previous month: the same period one month ago
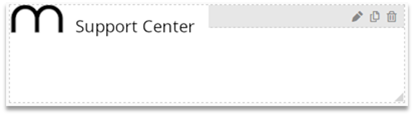
3.3 Dynamic Box
The "Dynamic Box" provides a flexible input area to add e.g., notes, pictures, presentations
and links to the report.
Inserting images from websites:
Right-click on the image and copy it.
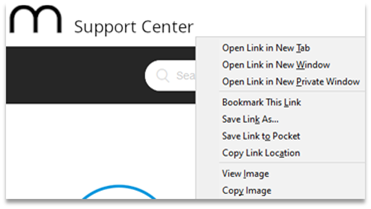
Click in the Dynamic Box, make a right click and choose "Paste".
Inserting images from YouTube videos:
Open the video on YouTube and choose "Share > Embed".
Select options as desired and click "Copy".
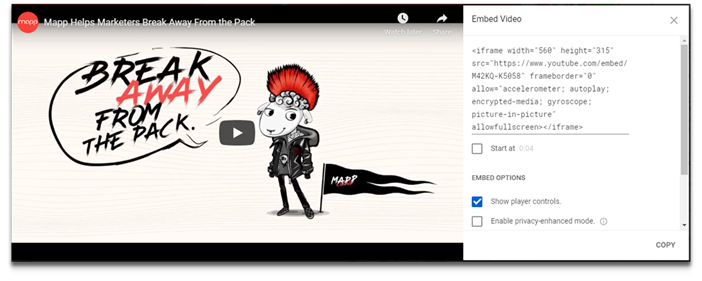
Click on the Dynamic Box, choose the source code symbol, and paste the code.
If necessary, change the size of the dynamic box by dragging it with the mouse.
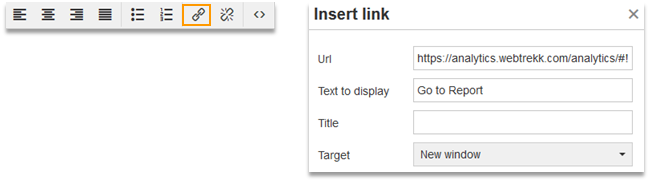
Inserting a link to another Mapp Intelligence report that is available in this login:
Click on Reports > Overview and choose "… > Share" at the report that you want to link to. Afterwards, copy the link.
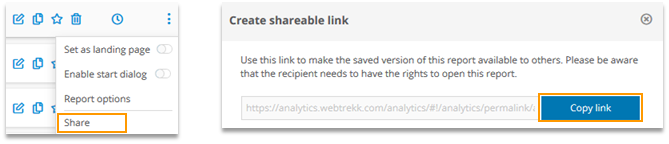
Paste the report into the dynamic box. Choose the link symbol and enter the link at "Url".
3.4 Report filter
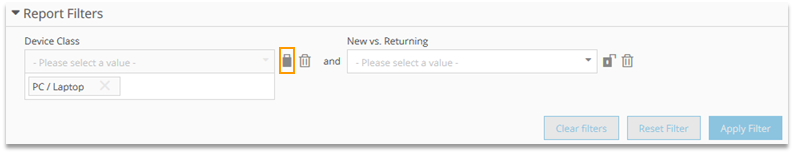
The underlying data of report elements can be restricted using a superordinate filter. Often limited to countries, device classes, or campaign channels is of interest.
.gif)
Report filters don‘t have an effect on Dynamic Boxes. LIVE elements can only be filtered on some of the dimensions.
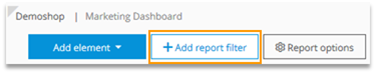
You can add filters in the Edit mode at "Add report filter." This filter can be applied to any dimension.
Filters can be locked by clicking on the "lock" symbol. In the report view, these filters cannot be adapted.
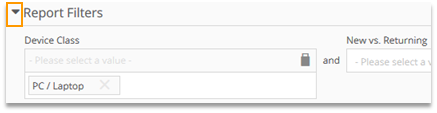
The whole filter area can be shown or hidden. Also, this setting is saved.
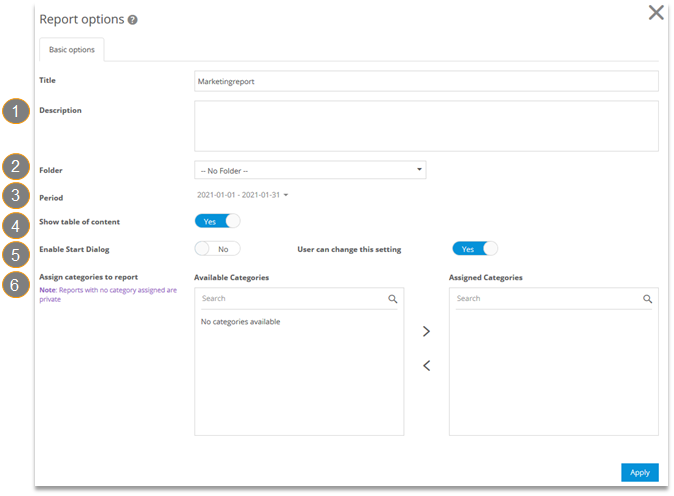
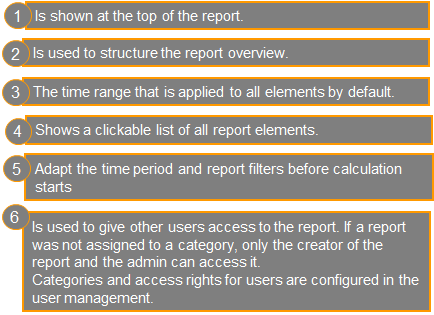
4 Report options
The report options allow for various adaptions.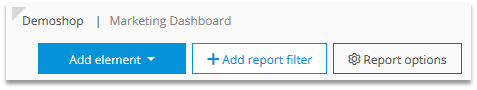
Basic Options
You can find more information here.
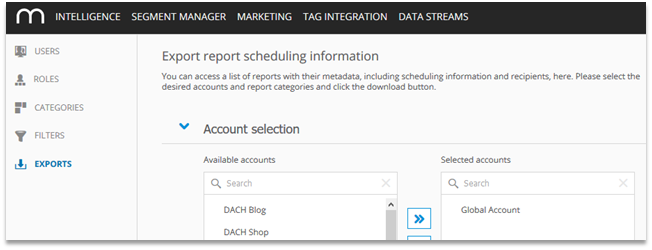
5 Metadata Export
In User Management, you can export the metadata of all reports to an Excel file. This functionality can help administer reports.
Among others, the following data is included in the export:
Date of Creation
Last edited at/by
Description
Schedule status
Recipients
You also can export data of reports belonging to specific categories or specific accounts.
To use this functionality, click on your login name and choose User Management > Exports.
This option is only available for users in the Admin role. |
|---|