In Mapp Intelligence, every analysis is built using dimensions and metrics. Here’s a simple breakdown of what these terms mean:
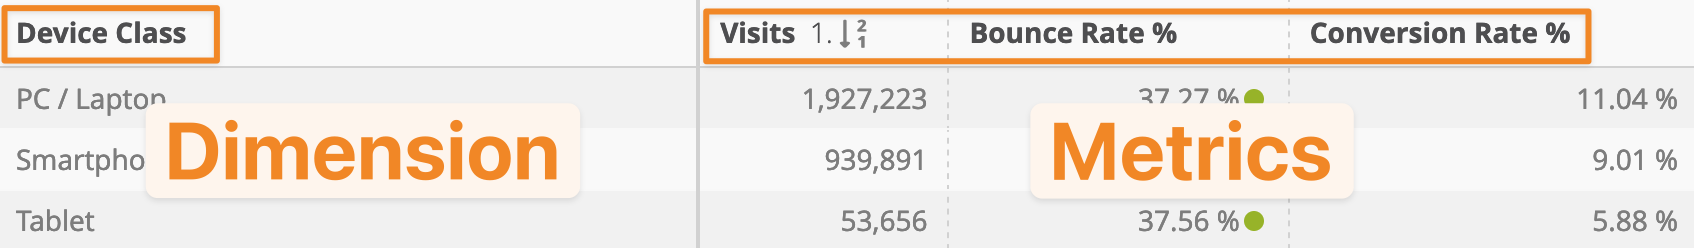
Dimensions: Think of a dimension as a way to describe what you’re looking at in your data. It’s like a label or category that helps you organize information. For example, dimensions could include things like Country, Device Type, or Campaign Source. They answer the question: “What am I analyzing?”
Metrics: A metric is a number that shows you how often or how much something happens. It’s a measurement tied to the dimensions you’ve chosen. For example, metrics include Page Views, Conversions, or Revenue. They answer the question: “How many?” or “How much?”
For simplicity, the term “metrics” is used throughout the Mapp Intelligence interface and in this documentation. However, it’s important to note that metrics include both raw measurements and formulas—where formulas are calculations derived from other metrics to provide deeper insights. Both metrics and formulas are collectively referred to as figures.
By understanding these key concepts, you can adjust your analysis by adding or changing dimensions and metrics to better focus on the data that matters most to you, whether it’s tracking the performance of marketing campaigns or examining user engagement.
Overview
An analysis typically starts with a set of predefined metrics and dimensions. However, you can add or change both dimensions and metrics to customize the analysis further or create a multi-dimensional view (pivot table). This flexibility allows you to explore complex data relationships and answer specific business questions more effectively.
Working with Metrics
Adding Metrics
Click Add Metric to open a view of available metrics.
Choose your metrics from either the group view or list view, where you can also search by metric name.
Once selected, confirm your choices by clicking Apply.
Removing Metrics
Right-click on the metric name to open the context menu, then select Remove Metric.
Duplicating and Swapping Metrics
For flexibility, you can duplicate a metric and swap it with a different type within the same analysis while keeping any filters in place. This feature is useful for experimenting with different metrics without losing the original setup. (Refer to the video guide below for step-by-step instructions.)
Organizing Metrics
Sorting and Priority
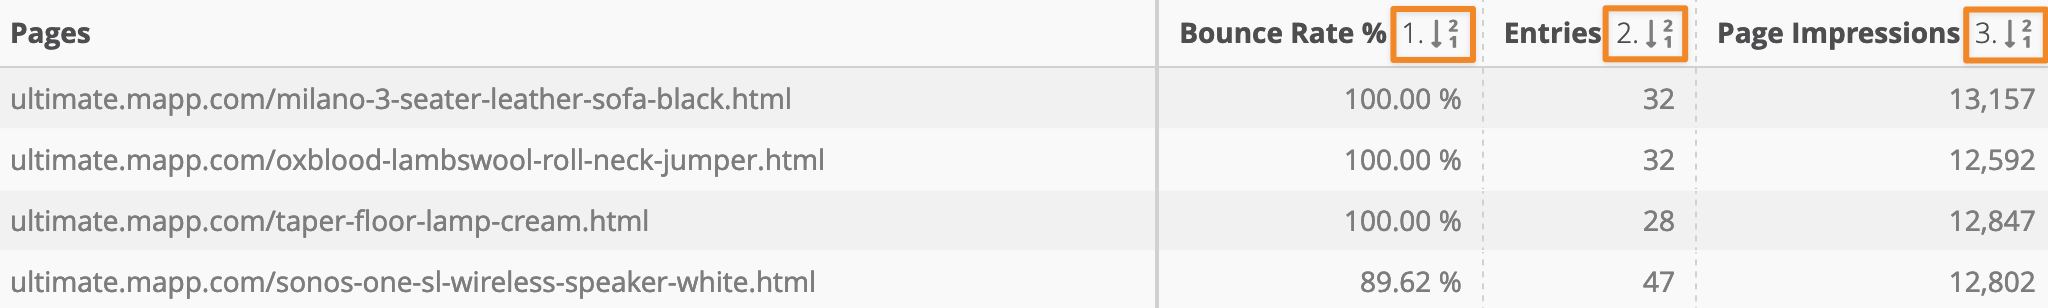
You can sort metrics and dimensions in either ascending or descending order directly from the context menu. An arrow will indicate the sorting direction, and numbers show the priority.
Up to three levels of sorting are possible (Priority 1 as highest and Priority 3 as lowest). If multiple values occur for the first priority, the system will sort by the next priority metric.
Example: You might first sort by Bounce Rate, followed by Entries, and then by Page Impressions.
Drag-and-Drop Reordering
Rearrange metrics in the data table by dragging and dropping them. Just click on the metric or dimension name and position it as desired.
Working with Dimensions
In addition to metrics, dimensions allow you to break down your analysis to gain a more granular view of your data. Adding multiple dimensions creates a multi-dimensional analysis, which can be visualized as a pivot table.
Creating a Multi-Dimensional Analysis (Pivot Table)
To create a pivot table, start by adding one or more dimensions to your analysis.

Switch between hierarchy view and list view using the respective buttons:

Hierarchy View: Allows you to see nested relationships between dimensions. You can sort dimensions by dragging and dropping them.
.png)
Adjust the row limit in the hierarchy view to control the amount of data displayed.

The number displayed for the upper-level dimension shows the unique total count of metric values for all elements below it, even if not all elements are visible due to row limits.
List View: Provides a simpler, flat view of dimensions.
.png)
Adding and Removing Dimensions
Adding Dimensions: Click on Add Dimension and select from the list of available options to include more data layers in your analysis.
Removing Dimensions: Right-click on a dimension and select Remove Dimension to simplify your analysis.
Saving and Resetting Your Analysis
Adjustments to metrics and dimensions are saved temporarily and will reset if you log out or switch accounts. To preserve your changes for future use:
Save the Analysis: This stores your custom setup, so it’s available the next time you access it. Learn more on this page.
To revert to the default setup, you can:
Reload the page (e.g., press F5).
Log out and log back in to reset to the default settings.
Switch to a different account and then return to the desired one to clear temporary adjustments.