The traffic analysis shows values of some important figures for each calendar day in the chosen analysis period.

The following dimensions and figures are available in the analysis (a click on the link leads to detailed information):
Dimension | Metric |
|---|---|
List view
In the "List" view, data is sorted by days by default.
Reading Example

Visits | 2,772 visits were made on 2018-10-31. |
Page Impressions | 32,362 pages were viewed on 2018-10-31. |
New Visit Rate % | 90.69 % of all visits were made by visitors that were recognized for the first time. Visitor recognition is based on cookies, and, if it is passed, the login information. |
Visit Duration Avg | A visit lasted on average 1 minute and 23 seconds. This value includes 30 seconds which are used as duration average for the exit page. |
Bounce Rate % | In 7.13 % of all visits, only one page was viewed. |
Comparison view
In the "Comparison" view, date ranges and segments can be compared on a daily basis.
Reading example
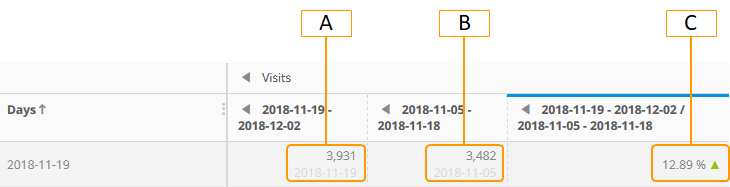
A: 3,931 visits were made on 2018-11-19.
B: 3,482 visits were made on 2018-11-05.
C: There were 12.89 % more visits on 2018-11-19 than on 2018-11-05.