In Mapp Intelligence, analyses can be visualized in multiple formats, allowing you to gain insights tailored to your specific needs. This article covers the different analysis views available and provides step-by-step instructions on how to configure and use them. Each section includes a practical example to demonstrate how to apply the analysis.
Mapp Intelligence supports the following analysis variants:
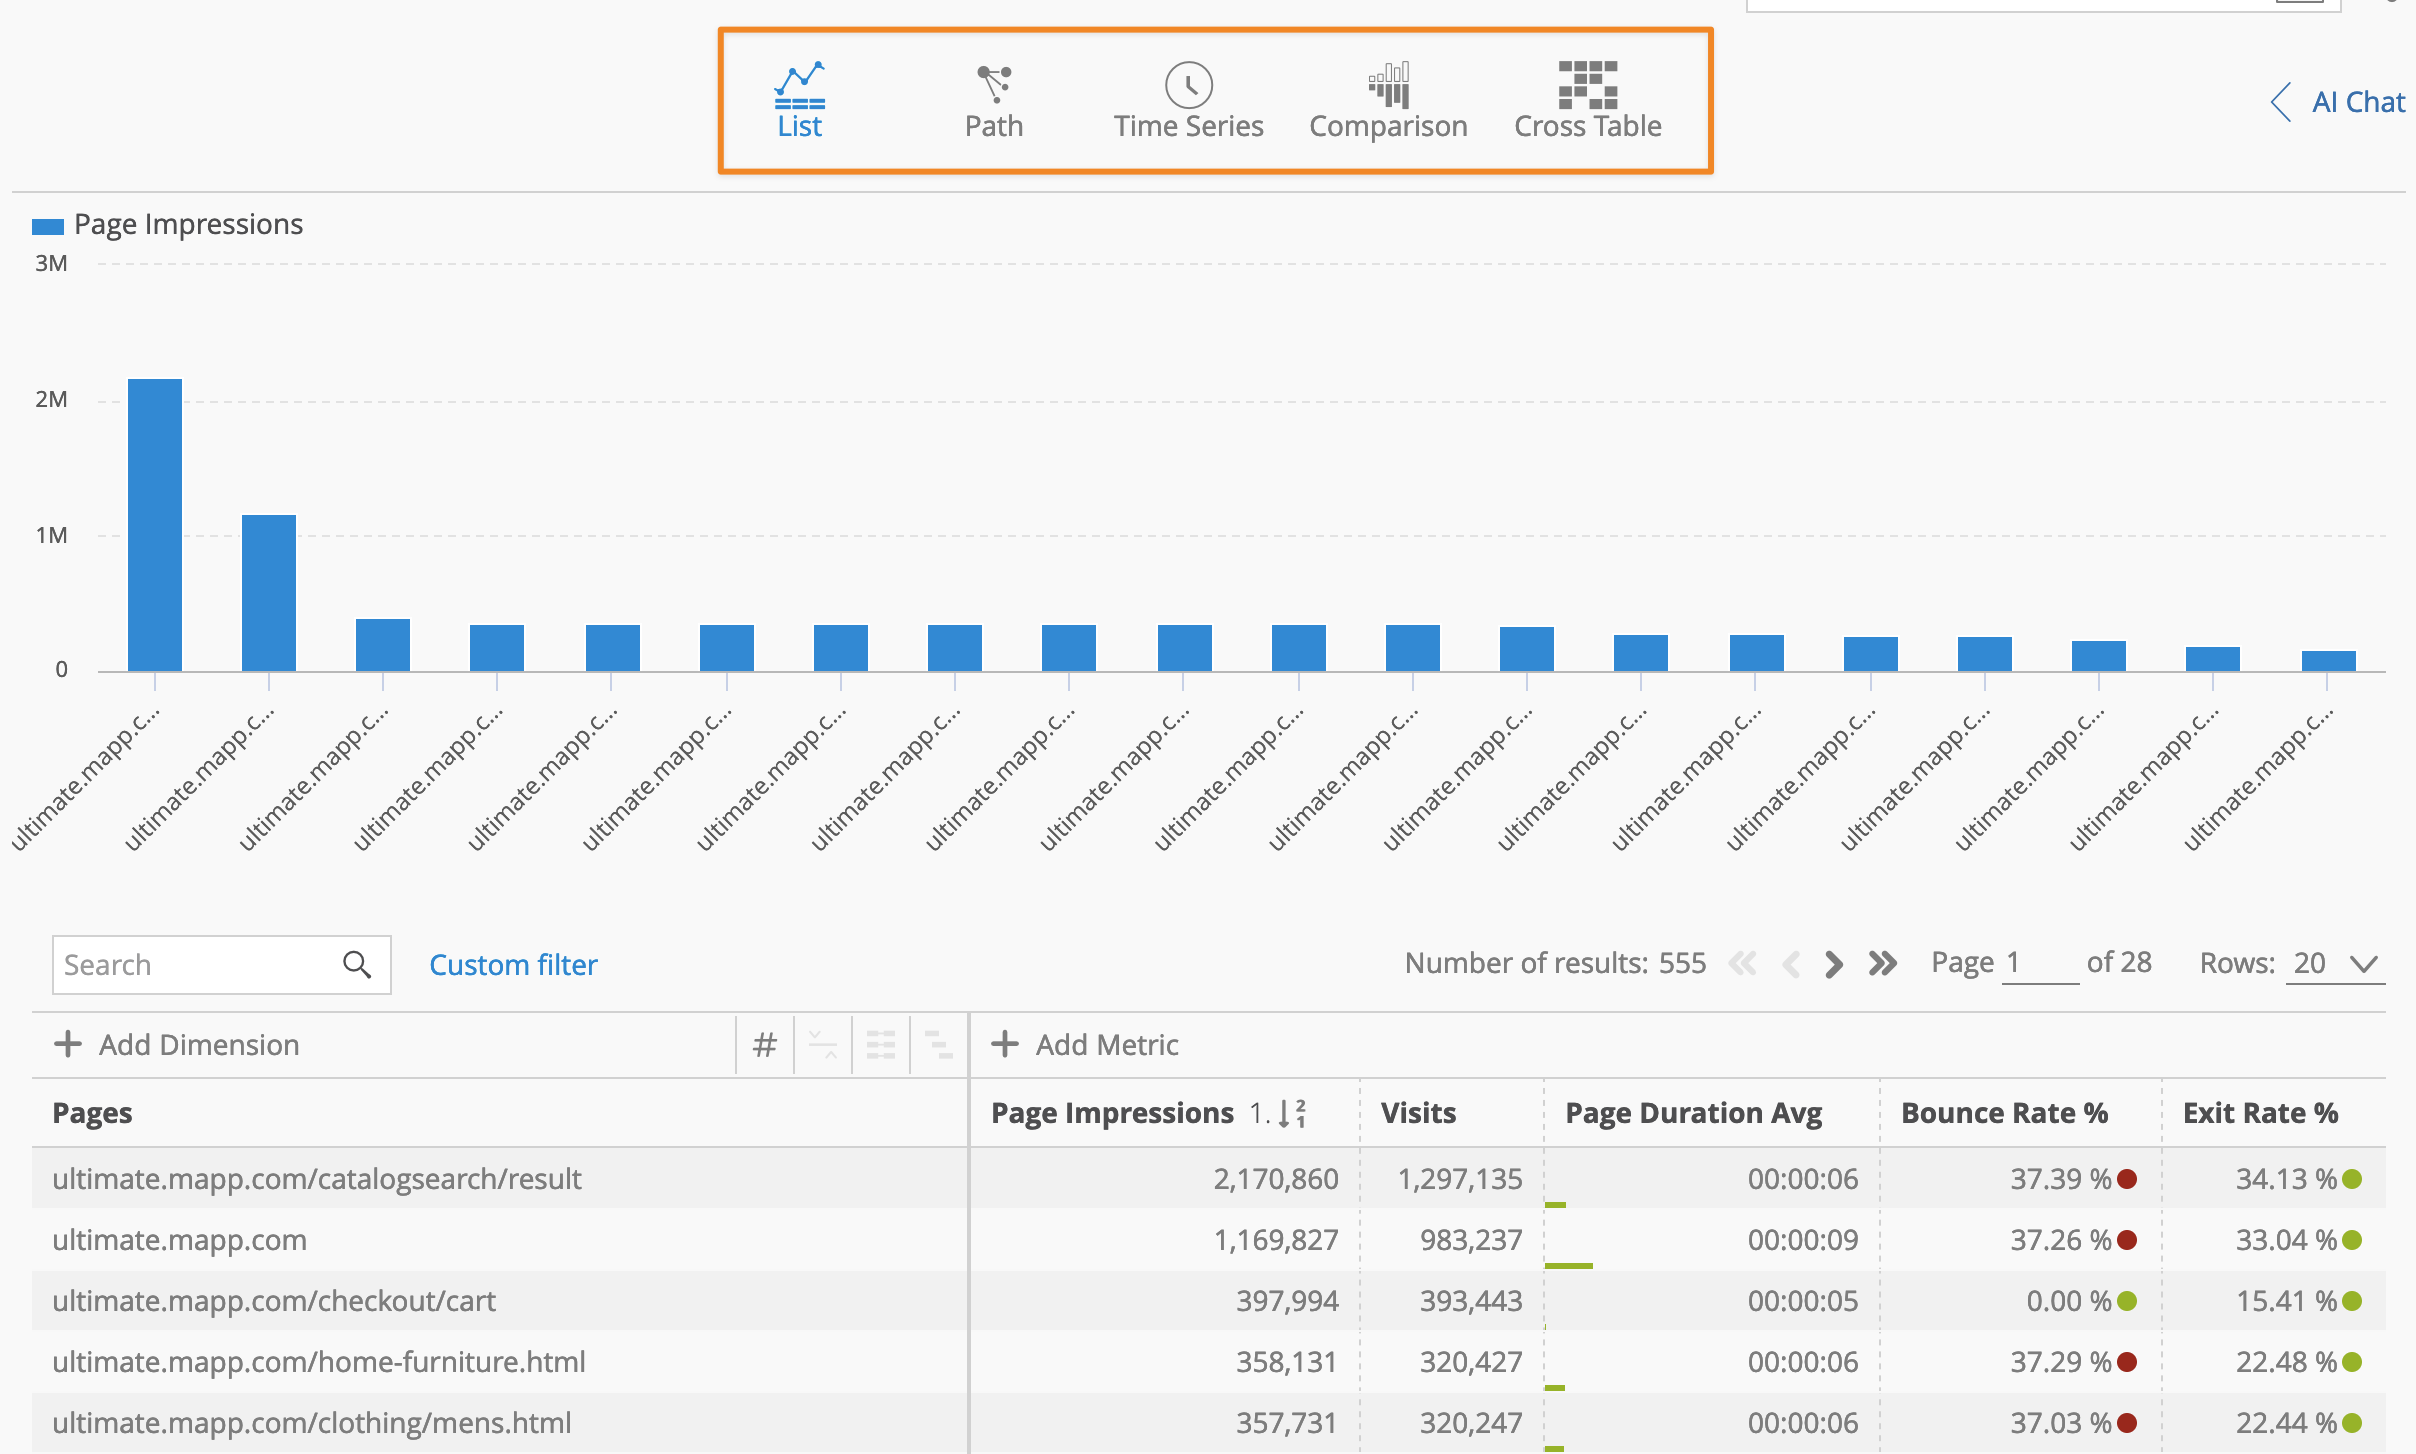
List: Displays data for single or multiple dimensions, including the option to use a Pivot Table.
Path: Analyzes visitor journeys and sequences of actions.
Time Series: Tracks changes in a dimension over a specific time range.
Comparison: Compares data across multiple time periods or user segments.
Cross Table: Combines two dimensions in a single view for deeper segmentation.
How to Select an Analysis variant
To switch between different analysis views, simply click on the corresponding icons directly above the analysis area. This intuitive interface allows you to toggle between views without navigating away from your current screen.